CTS Corporation Q2 2026 Financial Report: Detailed Investor Analysis
Key Highlights
- Robust Q2 Performance: CTS reported net sales of \$144.8 million, up from \$135.3 million in Q2 2025. Net earnings for the quarter were \$19.2 million, slightly higher than last year’s \$18.5 million.
- Revised 2026 Guidance: The company has raised its 2026 sales guidance to a range of \$565-\$585 million (previously \$560-\$580 million) and adjusted diluted EPS to \$2.55-\$2.70 (previously \$2.35-\$2.45).
- Strong Operating Metrics: Operating earnings reached \$26.8 million, up from \$22.7 million last year. Operating earnings as a percentage of net sales improved to 18.5% (vs. 16.8%). Adjusted operating earnings margin also rose to 18.9%.
- Free Cash Flow Growth: Free cash flow for the quarter was \$28.8 million, up from \$25.1 million in Q2 2025. For the six months ended June 30, free cash flow was \$41.1 million, up from \$36.2 million.
- Strong EBITDA Margins: Adjusted EBITDA margin improved to 25.4% in Q2 2026, from 23.0% in Q2 2025.
- Shareholder Returns: Cash dividend declared per share was \$0.04, consistent with prior periods.
- Balance Sheet Strength: Total shareholders’ equity stands at \$572.8 million, up from \$551.8 million at year-end.
- Non-GAAP Adjustments: CTS continues to use non-GAAP metrics to provide a clearer picture of operational performance, excluding items such as restructuring charges, acquisition-related costs, environmental charges, inventory fair value step-up, pension expenses, discrete tax items, and foreign currency impacts.
Price Sensitive and Shareholder-Relevant Items
- Upward Revision of Guidance: CTS’s decision to increase both sales and earnings guidance for 2026 reflects management’s confidence in ongoing business momentum and may be viewed positively by investors and analysts.
- Margin Expansion: The improvement in gross, operating, and EBITDA margins suggest strong cost control and pricing power, which are critical drivers of profitability and shareholder value.
- Cash Flow Strength: The company’s ability to generate high free cash flow relative to adjusted net earnings (135% for the quarter) underscores liquidity and potential for further shareholder returns (e.g., dividends, buybacks).
- Non-GAAP Reporting: CTS’s continued use of non-GAAP metrics (with detailed reconciliation) gives investors clarity on core business performance, especially after adjusting for items that may cloud the true operating picture.
- Risk Factors and Forward-Looking Statements: CTS highlights several risks that could materially affect future results, including supply chain disruptions, inflation/recession, tariffs, integration risks, government funding, technological change, reliance on key customers, geopolitical tensions (China, USMCA), environmental compliance, cyber security threats, and the impact of natural disasters or public health crises.
- Restructuring and Acquisition Activity: Continued optimization and restructuring efforts, alongside acquisition-related adjustments, suggest ongoing transformation and potential for operational improvements, though such actions carry execution risks.
Detailed Financial Metrics
- Sales: Q2 net sales: \$144.8M; Six-month net sales: \$284.0M; Annualized sales (based on Q2): \$579.1M.
- Gross Margin: Q2 gross margin: \$60M; Adjusted gross margin as a % of net sales: 41.5% (up from 38.7%).
- Operating Earnings: Q2 operating earnings: \$26.8M; Adjusted operating earnings: \$27.4M; Margin: 18.9% (up from 16.2%).
- Net Earnings: Q2: \$19.2M (EPS \$0.67 basic, \$0.66 diluted); Six months: \$36.4M (EPS \$1.27 basic, \$1.26 diluted).
- Adjusted Net Earnings: Q2: \$21.3M (EPS \$0.74); Six months: \$39.2M (EPS \$1.35).
- EBITDA: Q2: \$35.7M; Adjusted EBITDA: \$36.8M; Adjusted EBITDA margin: 25.4% (up from 23.0%).
- Free Cash Flow: Q2: \$28.8M; Six months: \$41.1M.
- Capital Expenditures: Q2: \$4.6M; Six months: \$9.6M.
- Shareholders’ Equity: \$572.8M (up from \$551.8M).
- Dividend: \$0.04 per share, consistent with prior periods.
Risks and Forward-Looking Considerations
- Supply Chain: Continued disruptions, especially involving rare earth elements and other critical materials, may impact production costs and delivery schedules.
- Macro Environment: Inflation, recession risk, tariffs, and broader economic uncertainties remain potential headwinds.
- Geopolitical Risks: Trade barriers, USMCA developments, U.S.-China relations, and other geopolitical tensions could affect international operations and financial results.
- Cybersecurity: Any incidents could have material impacts on business operations and financial performance.
- Environmental and Regulatory: Compliance and remediation expenses, as well as discrete tax changes, could impact future earnings.
- Integration and Restructuring: Risks associated with acquisitions and ongoing restructuring may affect earnings volatility and investor sentiment.
- No Obligation for Updates: CTS has stated it undertakes no obligation to update forward-looking statements, so investors should monitor news and filings for any changes.
Conclusion
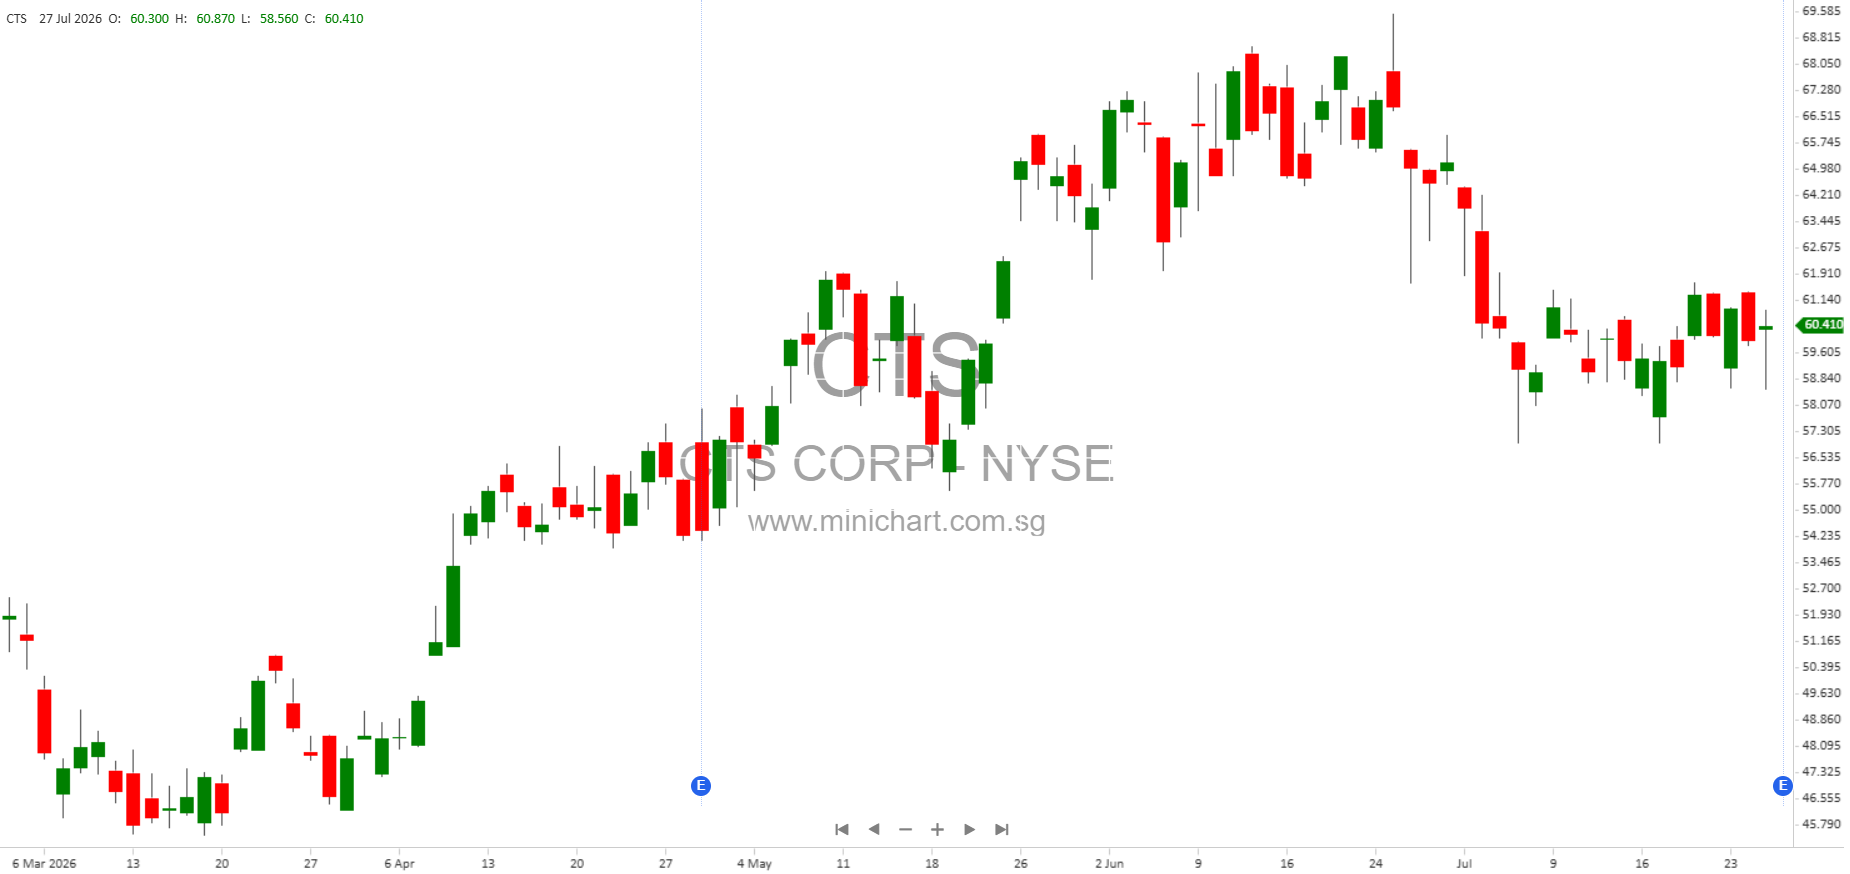
CTS Corporation’s Q2 2026 report reflects strong operational and financial momentum, highlighted by improved margins, robust cash flow, and an upward revision of guidance. These developments are likely to be viewed favorably by shareholders and could positively impact share values. However, investors should remain mindful of the various risk factors outlined by management, which could materially affect future performance.
Disclaimer: This article is for informational purposes only and does not constitute investment advice. Investors should conduct their own research and consult with financial advisors before making investment decisions. The information is based on management’s statements and published financial data, and actual outcomes may differ due to risks and uncertainties.