Community Financial System, Inc. (NYSE: CBU) Delivers Record Second Quarter 2026 Results and Raises Dividend
Key Highlights from Q2 2026 Earnings Report
- Record Net Income: Q2 2026 net income reached \$61.3 million, or \$1.16 per share, representing a 19.6% increase in earnings per share year-over-year. Operating net income was \$61.5 million, or \$1.16 per share, up 11.5% year-over-year and marking the fifth consecutive quarter of record results.
- Dividend Increase: Board approved a \$0.02 (4.3%) increase in the quarterly dividend to \$0.49 per share, payable October 13, 2026, marking the 34th consecutive year of dividend increases.
- Robust Loan Growth: Ending loans stood at \$11.28 billion, up 7.3% year-over-year and 1.4% quarter-over-quarter, mainly driven by organic growth in business and consumer lending.
- Net Interest Margin Expansion: Net interest margin rose to 3.46% (3.49% FTE), up 19 basis points year-over-year due to higher loan yields and lower funding costs.
- Strong Noninterest Revenue: Noninterest revenues contributed 38% of total revenues, with significant contributions from employee benefit services, wealth management, and a notable \$4.7 million gain on equity securities.
- Completion of ClearPoint Federal Bank & Trust Acquisition: Acquisition expands wealth management services, adding over \$1.5 billion in assets under management from ClearPoint, a leader in trust administration for the \$20 billion death care industry.
- Share Repurchase Program: 258,471 shares repurchased in the first half of 2026 as part of the Board-authorized buyback program for up to 2.63 million shares.
- Capital Strength Maintained: Shareholders’ equity rose 10.1% year-over-year to \$2.07 billion. All regulatory capital ratios remain well above “well-capitalized” thresholds.
- Asset Quality Remains Strong: Net charge-offs low at 0.12% of average loans. Allowance for credit losses at 0.81% of loans. Nonperforming assets represent 0.36% of total assets.
- Efficiency and Profitability: Operating efficiency ratio improved to 60.6% (non-GAAP). Operating return on assets at 1.40%; operating return on equity at 12.13%.
Detailed Financial and Strategic Review
Operating Performance and Profitability
The company reported record Q2 net income of \$61.3 million, or \$1.16 per diluted share, up from \$51.3 million, or \$0.97 per share, in Q2 2025. Operating diluted EPS rose 11.5% year-over-year to \$1.16, with operating pre-tax, pre-provision net revenue per share increasing 14.9% to \$1.62. Operating return on assets reached 1.40%, while operating return on equity was 12.13%.
Net Interest Income and Margin
Net interest income surged to \$139.1 million, up 11.5% year-over-year and 3.3% quarter-over-quarter. Net interest margin improved to 3.46%, with a fully tax-equivalent margin of 3.49%. This expansion was driven by a 5 basis point increase in asset yields and an 18 basis point decrease in funding costs, including a 15 basis point reduction in interest-bearing deposit rates. The cost of funds declined to 1.18%, and the cost of total deposits dropped to 1.07%.
Noninterest Revenue Growth
- Banking noninterest revenues: \$21.3 million, up 6.1% year-over-year, driven by higher debit interchange and ATM fees.
- Employee benefit services: \$34.9 million, up 7.7% year-over-year, benefiting from recordkeeping and third-party administration services growth.
- Wealth management services: \$10.4 million, up 19.8% year-over-year, reflecting the ClearPoint acquisition and higher market values of assets under management.
- Insurance services: \$13.2 million, down 1.4% year-over-year due to a softer insurance market, but up 4.8% quarter-over-quarter.
- Equity securities gain: \$4.7 million, including a \$3.3 million gain from the sale of a limited partnership investment and \$0.9 million from Visa Class B share conversion.
Expense Management and Investments
Total noninterest expenses rose 6.7% year-over-year to \$137.7 million, primarily from higher salaries, technology investments, and occupancy costs:
- Salaries and benefits up 4.3% due to acquisitions, new branches, and merit increases.
- Data processing and communications up 17.9% with ongoing investment in digital and AI technologies, including a one-time \$0.6 million termination charge.
- Occupancy and equipment expenses up 20.9% from de novo branches and the Santander Bank branch acquisition.
The effective tax rate increased to 24.1%, due to higher state income taxes and reduced tax benefits from stock-based compensation.
Balance Sheet, Liquidity, and Capital Strength
- Total assets increased 6.6% year-over-year to \$17.76 billion, primarily due to organic loan growth, the Santander branch acquisition, and the ClearPoint acquisition.
- Loan portfolio grew 7.3% year-over-year to \$11.28 billion; deposits increased 7.4% to \$14.7 billion.
- Shareholders’ equity increased 10.1% to \$2.07 billion. Tangible equity to tangible assets ratio improved to 6.86%.
- Tier 1 leverage ratio of 9.26% remains well above the regulatory standard.
- Allowance for credit losses stable at 0.81% of loans; nonperforming assets at a low 0.36% of total assets.
Dividend and Capital Return to Shareholders
- Quarterly dividend raised to \$0.49 per share, the 34th consecutive annual increase, reflecting management’s confidence in future performance.
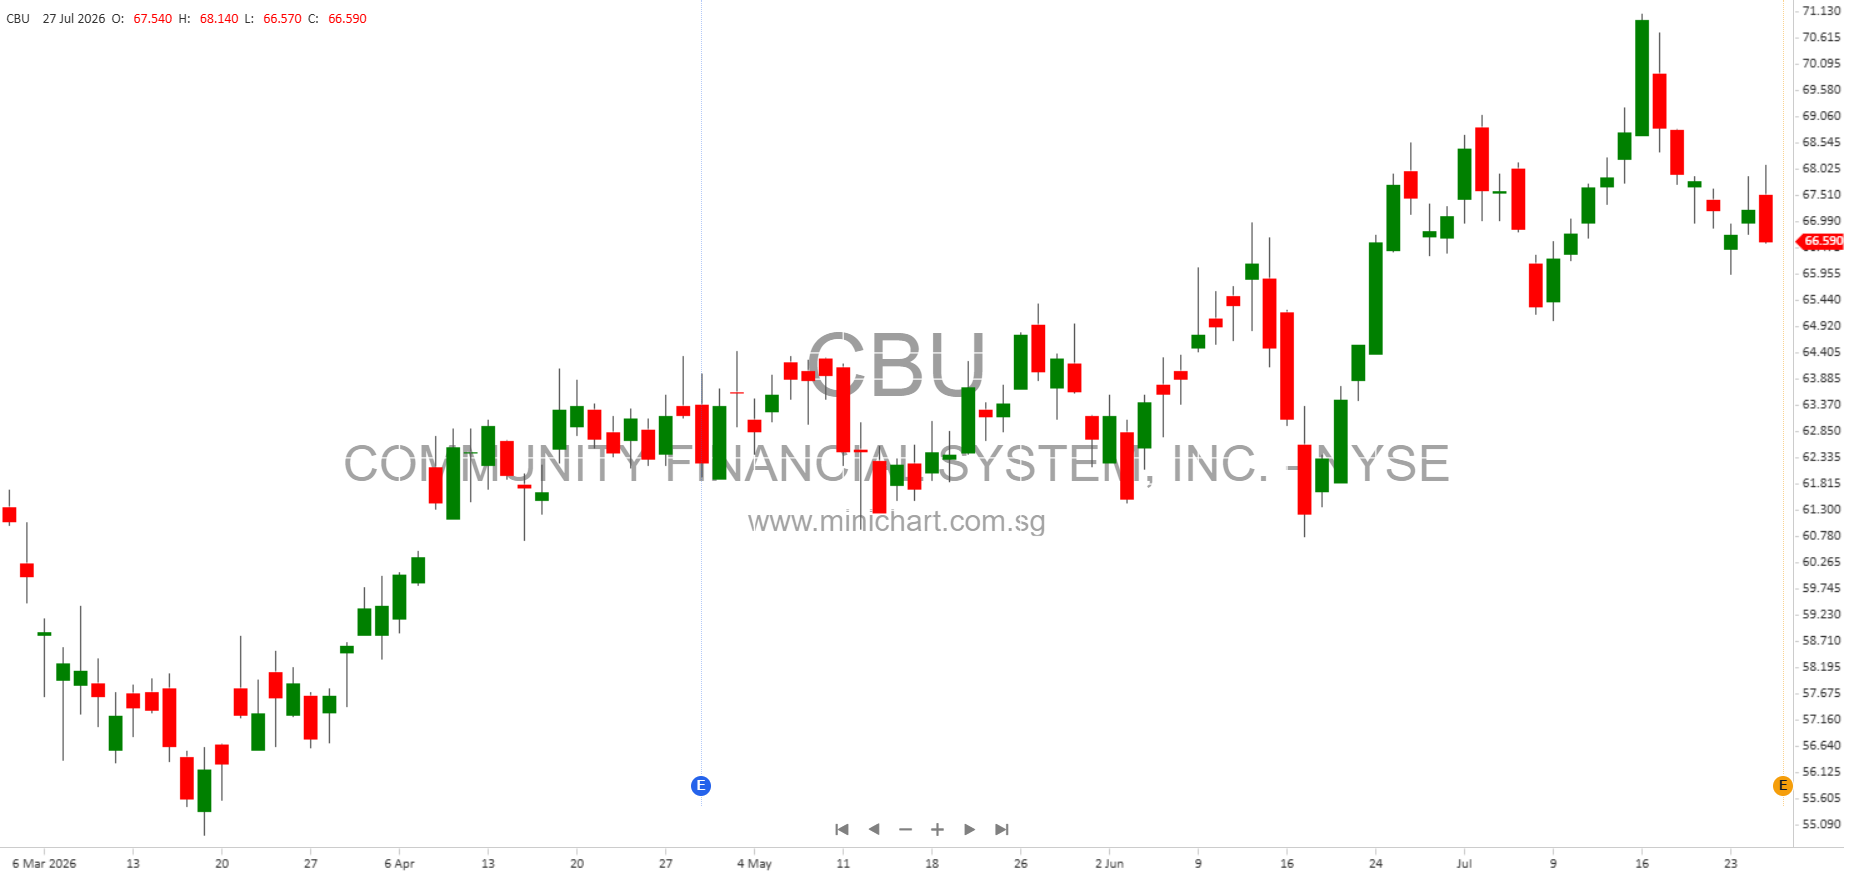
- Annualized dividend yield at 2.9% based on the July 27, 2026 closing price of \$66.59.
- Ongoing 2026 repurchase program: 258,471 shares repurchased in H1 2026.
Strategic Expansion: ClearPoint Acquisition
On June 1, 2026, Community Financial System, Inc. announced the completion of its acquisition of ClearPoint Federal Bank & Trust. ClearPoint is a national leader in trust administration for the \$20 billion death care industry, with over \$1.5 billion in assets under management and a three-year revenue CAGR of 9.7%. This acquisition is expected to accelerate growth in the company’s wealth management segment and add to noninterest revenues going forward.
Outlook and Shareholder Considerations
- Strong organic growth across all four business lines is expected to continue, with further acceleration anticipated in the second half of 2026.
- Continued investments in technology (including AI), efficiency, and expansion are expected to enhance long-term growth and profitability.
- Solid capital position and prudent risk management provide flexibility for further acquisitions, dividend increases, and share buybacks.
- Shareholder returns: The combination of robust earnings growth, dividend increases, and share repurchases underpins management’s commitment to shareholder value and is likely to be viewed positively by the market.
Potential Price-Sensitive Information
- Record financial performance and a fifth consecutive quarter of record operating EPS can drive positive sentiment and upward share price movement.
- Dividend increase signals management’s confidence in sustainable earnings power, which is typically well-received by income-oriented investors.
- ClearPoint acquisition positions the company for accelerated growth in high-value wealth management services, likely to be viewed favorably by the market.
- Ongoing share repurchases reduce share count and may support share price appreciation.
- Strong capital and asset quality metrics reduce downside risk, increasing the company’s attractiveness relative to peers.
Conference Call and Further Information
Management will host a conference call at 11:00 a.m. ET on July 28, 2026, to discuss results. Webcast and replay are available at the company’s investor relations website.
Disclaimer: This article is for informational purposes only and does not constitute investment advice. Investors should conduct their own research or consult a financial advisor before making investment decisions. Past performance is not indicative of future results. This summary is based on the company’s public filings as of July 28, 2026, and may contain forward-looking statements subject to risks and uncertainties.