Commercial Bancgroup, Inc. Announces Strong Second Quarter 2026 Results
Key Financial Highlights
- Net Income: \$10.2 million for Q2 2026, up from \$8.9 million in Q2 2025.
- Earnings Per Share: \$0.75 per common share, unchanged from core EPS in Q2 2025.
- Core Net Income: \$10.2 million, or \$0.75 per share, compared to \$9.1 million, or \$0.75 per share in Q2 2025.
- Return on Average Assets (ROAA): 1.78% (core ROAA also 1.78%).
- Return on Average Equity (ROAE): 13.73% (core ROAE also 13.73%).
- Return on Average Tangible Common Equity (ROATCE): 14.26% (core ROATCE).
- Net Interest Margin: 4.06%, up 18 basis points from Q1 2026.
- Core Efficiency Ratio: 44.99%.
- Loans Outstanding: Increased by \$48.4 million, or 2.6% from Q1 2026 to \$1.94 billion.
- Book Value Per Share: \$22.09, up \$0.66 (3.1%) from Q1 2026.
- Tangible Book Value Per Share: \$21.28, up \$0.68 (3.3%) from Q1 2026.
- Asset Quality: Net charge-offs to average loans of 0.00%; nonperforming assets to total assets at 0.31%.
Year-To-Date Performance
- Net Income: \$19.8 million for the first six months of 2026, up from \$17.6 million in 2025.
- EPS (Six Months): \$1.44 (unchanged from 2025).
- ROAA: 1.72% vs. 1.55% in 2025.
- ROAE: 13.48% vs. 15.71% in 2025.
- Total Operating Revenue: \$47.2 million, up from \$44.1 million in 2025.
- Non-interest Expense: \$22.0 million vs. \$21.3 million in 2025.
- Book Value Per Share: \$22.09 as of June 30, 2026 (\$19.22 in 2025).
- Tangible Book Value Per Share: \$21.28 as of June 30, 2026 (\$18.22 in 2025).
- Core Efficiency Ratio: 45.2% (improvement from 47.7% in 2025).
Balance Sheet and Capital Position
- Total Assets: \$2.4 billion as of June 30, 2026 (\$2.3 billion in 2025).
- Loans Outstanding: \$1.9 billion, up \$149 million (8.3%) year-over-year.
- Deposits: \$1.9 billion, up \$21.9 million (1.2%).
- Noninterest Bearing Demand Deposits: \$428.4 million, up 3.0%.
- Non-brokered Deposits: \$1.8 billion, up \$91.8 million (5.3%).
- Asset Quality: Nonperforming assets to total assets at 0.31% (slightly up from 0.30%).
- Allowance for Credit Losses: 0.96% of total loans, down from 1.00% in 2025.
- Capital Ratios:
- Total Risk-Based Capital Ratio: 14.0%
- Tier 1 Risk-Based Capital Ratio: 13.0%
- Common Equity Tier 1 Ratio: 13.0%
- Tier 1 Leverage Ratio: 11.6%
Operational Developments
- Non-interest Income: \$2.7 million for Q2 2026, up \$0.4 million (19.2%) year-over-year, mainly from customer service and ATM fees.
- Non-interest Expense: Increased only slightly by \$0.1 million (1.4%).
Shareholder-Impacting Changes
- Stock Reclassification and Split: Prior to the October 2025 IPO, Commercial Bancgroup had three classes of common stock. On September 18, 2025, all shares of Class B and Class C stock were reclassified to common stock (Class B converted at 1.15:1; Class C at 1.05:1), followed by a 250-for-1 forward stock split. Financials reflect these changes retroactively.
- IPO Impact: The IPO occurred after September 30, 2025, with financial impacts reflected in Q4 2025 and onwards.
- Share Count: 13,701,270 common shares outstanding as of June 30, 2026, up from 12,239,644 a year earlier.
- Book Value and Tangible Book Value Per Share: Significant increases, which may positively affect share valuation and investor confidence.
- Efficiency Improvements: The core efficiency ratio has improved, implying better cost management.
- Asset Quality Slightly Deteriorated: Nonperforming assets ticked up marginally, and allowance for credit losses declined. While asset quality remains strong, any further deterioration could become a concern for investors.
- Robust Capital Position: All key regulatory capital ratios remain well above minimum requirements, supporting future growth and stability.
- Branch and Employee Count: Stable at 34 branches and 293 full-time equivalent employees.
Potential Share Price Movers
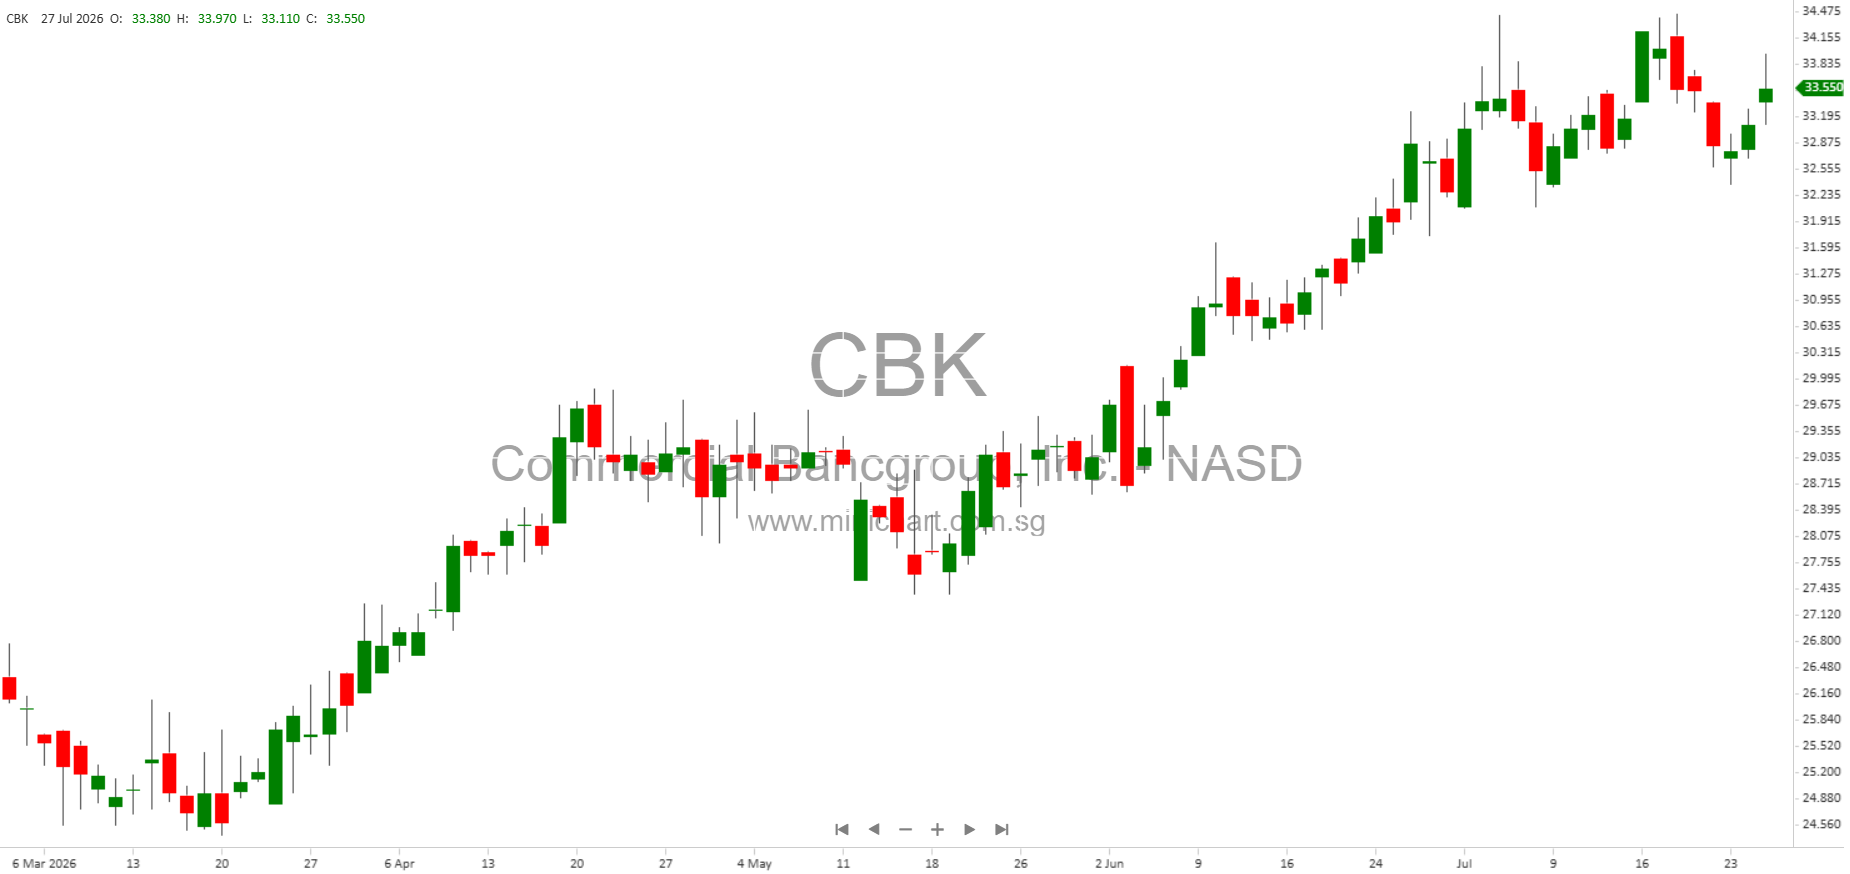
- Strong earnings growth (15% increase in net income) and improved profitability ratios could drive share price higher.
- Increase in book value and tangible book value per share may positively influence market valuation.
- Improved efficiency ratios and cost management, alongside growth in core deposits and loans, reinforce operational strength.
- The IPO and retroactive stock reclassification/split are already reflected in financials, removing uncertainty and providing clarity for investors.
- Asset quality remains solid, but shareholders should monitor slightly higher nonperforming assets and lower allowance for credit losses.
Summary Table: Selected Key Metrics
| Metric | Q2 2026 | Q2 2025 | Change |
|---|---|---|---|
| Net Income | \$10.2M | \$8.9M | +15% |
| EPS (Core) | \$0.75 | \$0.75 | Flat |
| ROAA | 1.78% | 1.57% | +21 bps |
| ROAE | 13.73% | 15.57% | -184 bps |
| Net Interest Margin | 4.06% | 3.84% | +22 bps |
| Book Value Per Share | \$22.09 | \$19.22 | +15% |
| Tangible Book Value Per Share | \$21.28 | \$18.22 | +17% |
| Nonperforming Assets / Total Assets | 0.31% | 0.30% | +0.01 pp |
Conclusion
Commercial Bancgroup, Inc. has delivered solid financial performance in the second quarter and first half of 2026, with higher net income, improved margins, increased book value, and strong capital ratios. While asset quality has marginally declined, the company’s overall financial health remains robust. The operational improvements and positive trends in core business metrics are likely to support continued investor confidence and could potentially drive share price appreciation. Shareholders should continue to monitor asset quality trends and cost management as the company pursues growth in its core markets.
Disclaimer
This article is for informational purposes only and does not constitute investment advice or a recommendation to buy or sell any securities. Investors should conduct their own due diligence and consult with their financial advisors before making any investment decisions. All information provided is based on the latest available financial disclosures from Commercial Bancgroup, Inc. and is subject to change without notice.