Sierra Bancorp Q2 2026 Financial Results: Detailed Investor Report
Executive Summary
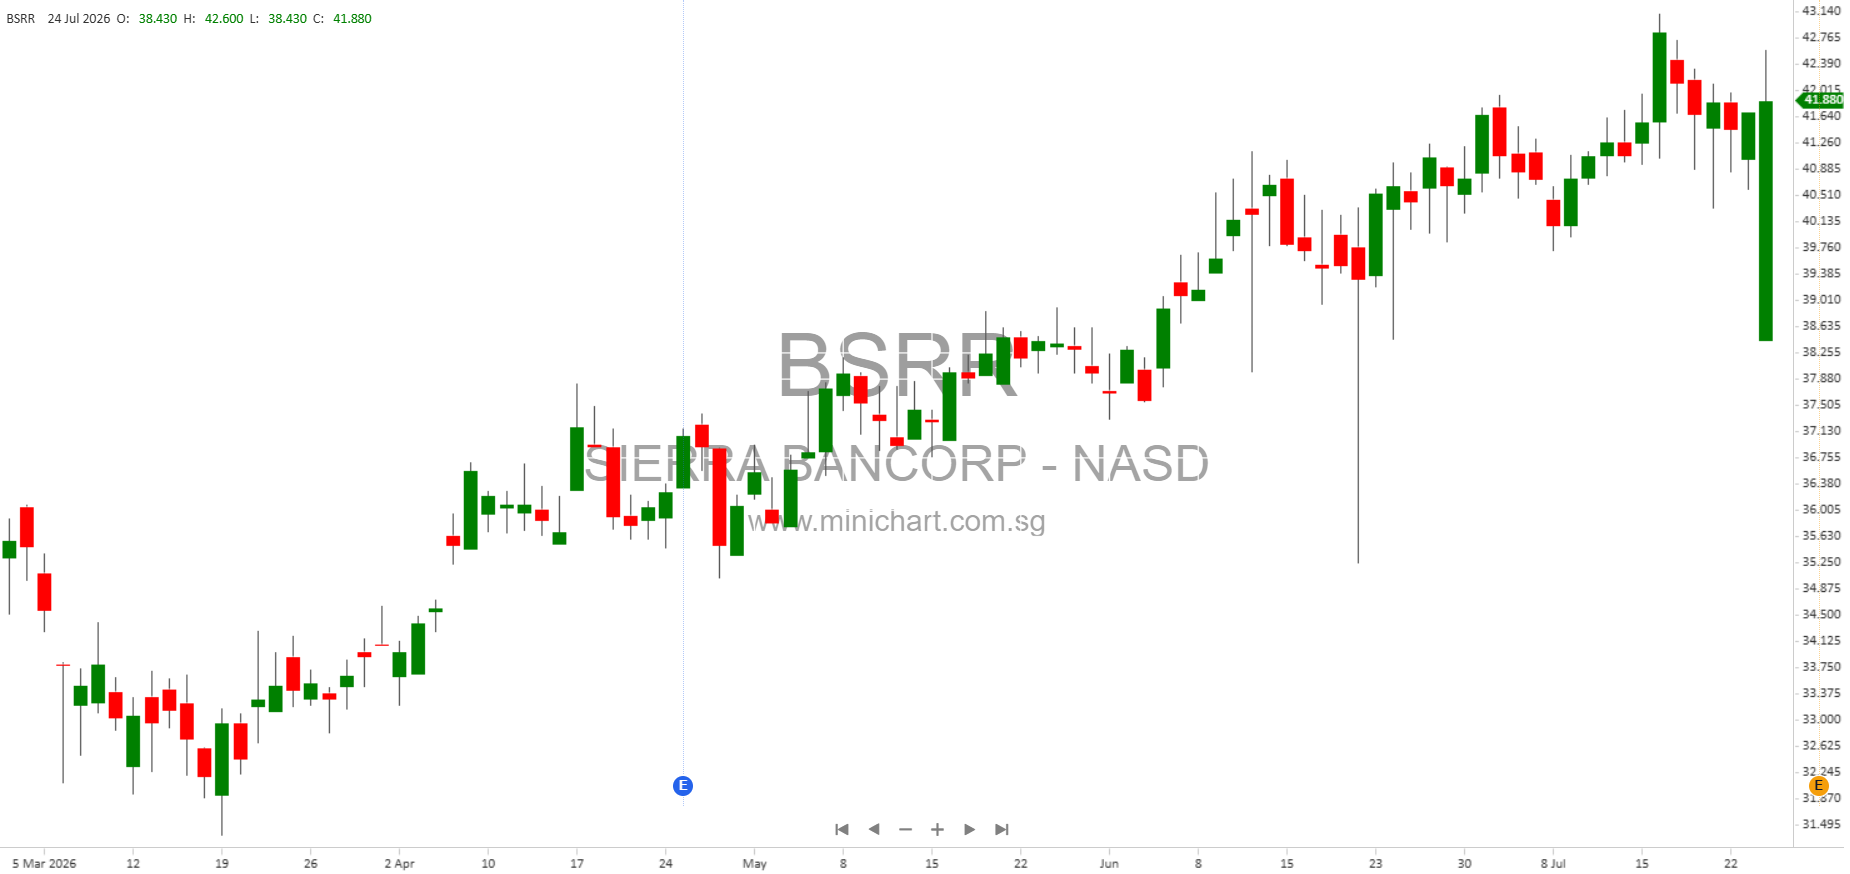
Sierra Bancorp (Nasdaq: BSRR), parent of Bank of the Sierra, has released its unaudited financial results for the second quarter and first half of 2026. The report showcases a mixture of continued profitability, deposit growth, capital strength, and some notable challenges in credit quality and expenses. Investors should pay attention to several developments that could impact share values.
Key Financial Highlights
- Q2 2026 Net Income: \$9.9 million (\$0.77/diluted share), down 7% from \$10.6 million (\$0.78/diluted share) in Q2 2025.
- H1 2026 Net Income: \$22.4 million (\$1.72/diluted share), up 14% from \$19.7 million (\$1.43/diluted share) in H1 2025.
- Return on Average Assets: 1.09% for Q2; 1.24% YTD (vs. 1.09% in H1 2025).
- Return on Average Equity: 10.90% for Q2; 12.38% YTD (vs. 11.26% in H1 2025).
- Net Interest Margin: Stable at 3.75% for H1 2026 (up from 3.71% in H1 2025).
- Efficiency Ratio: Improved to 57.70% for H1 2026 (from 60.00% in H1 2025), indicating better cost management.
- Deposit Franchise Strength: Total deposits up \$54.6 million (+2%) from December 2025; noninterest-bearing deposits at \$1.03 billion (35% of total).
- Cost of Deposits: Declined to 1.11% (from 1.30% in Q2 2025); cost of funds at 1.31% (down from 1.49%).
- Capital and Liquidity: Tangible book value per share up to \$26.19; repurchased 396,429 shares; declared dividend of \$0.27/share (payable August 10, 2026); strong Community Bank Leverage Ratio (12.25%). Liquidity sources total \$1.9 billion.
Management Commentary & Outlook
“We are proud to serve Central Valley and Central Coast of California. Our strong commitment is reflected in continued deposit growth during 2026. The surge in loan growth in the last couple months demonstrates our team’s laser focus on both loan and deposit growth. Our loan pipeline increased significantly, and we expect net loan growth in the second half of 2026. Our expense management resulted in a nearly 2% cost reduction YTD compared to last year. We closed the quarter with contagious optimism throughout our Bank, boosting my confidence in what we can accomplish in the next six months and beyond!” — Kevin McPhaill, CEO and President
Quarterly & Year-to-Date Income Analysis
- Q2 2026 Net Income: Decreased by \$0.7 million due to stable net interest income, slight increase in noninterest income, and a decrease in noninterest expense. The expense includes \$0.5 million in severance and recruitment charges from executive restructuring.
- Credit Loss Expense: Increased by \$1.1 million, mainly due to a \$2.5 million specific reserve on a single agri-production loan (lumber industry).
- Noninterest Income/Expense: \$0.4 million increase in earnings from separate account life insurance; \$0.1 million increase in deferred compensation expense. Deferred compensation and insurance are designed to offset each other.
- Pre-tax Pre-provision Income: \$15.5 million, slightly up compared to Q2 2025.
- Linked Quarter: Net income down \$2.6 million from Q1 2026, mainly due to the aforementioned credit loss and higher noninterest expense from deferred compensation and severance costs.
- YTD Comparison: Net income up \$2.7 million (+14%); driven by higher noninterest income (+\$1.3 million), lower credit provision (-\$1.1 million), and lower noninterest expense (-\$0.9 million).
Balance Sheet Developments
- Total Assets: Down \$108.7 million (-3%) to \$3.72 billion since December 2025, due to loan and investment security declines offset by higher cash balances.
- Loan Activity: Mortgage warehouse balances down \$60.9 million, reflecting typical mortgage origination cycles. Strong loan production late in Q2, especially in commercial real estate and C&I, expected to boost H2 growth.
- Loan Rollforward: Q2 2026 new credit extended was \$49.4 million (+\$41.6 million over Q1); paydowns/maturities totaled \$59.6 million.
- Deposit Trends: Customer deposits up \$57.5 million; brokered deposits down \$2.9 million. Other interest-bearing liabilities reduced to \$155.0 million (from \$302.7 million), mainly due to less overnight borrowing for mortgage warehouse lending.
- Capital: \$366.9 million at June 30, 2026; increased by net income, offset by \$14.4 million in share repurchases and \$6.8 million in dividends. Book value per share at \$28.30, tangible book value at \$26.19.
Asset Quality & Credit Risk
- Nonperforming Assets: Down \$4.3 million to \$10.5 million; NPLs to gross loans improved to 0.43% (from 0.52%).
- Allowance for Credit Losses: Increased to \$23.6 million (0.96% of gross loans), reflecting the large reserve for the single agri-production loan.
- Charge-offs: Net charge-offs were minimal (0.01% YTD, not annualized).
Liquidity & Funding
- Liquidity Sources: Total \$1.9 billion (cash, unpledged securities, FHLB, fed lines, etc.).
- Cost of Funds: Continued decline, supporting net interest margin.
Shareholder Actions & Price Sensitivity
- Dividend: \$0.27/share declared, payable August 10, 2026.
- Share Repurchase: Significant buyback of 396,429 shares in H1 2026, reducing shares outstanding and supporting EPS growth.
- Expense Management: YTD expenses down ~2%, boosting efficiency ratio and profitability.
- Loan Pipeline: Management expects strong net loan growth in H2, which, if realized, could be a positive catalyst for future earnings.
- Credit Losses: The large reserve for a single agricultural loan may indicate sector risk and could affect investor sentiment if similar issues arise in the future.
Potential Price Movers & Risks
- Positive: Improved YTD profitability, cost management, capital strength, and expected loan growth.
- Negative: Q2 earnings decline, single large credit loss, executive restructuring costs, and asset shrinkage.
- Neutral: Noninterest income and expense largely offset each other; net interest margin stable.
- Risks: Further credit losses in agri-production or other sectors, potential for expense volatility, execution risk on projected loan growth.
Detailed Financial Metrics
| Metric | Q2 2026 | Q2 2025 | H1 2026 | H1 2025 |
|---|---|---|---|---|
| Net Income (\$M) | 9.9 | 10.6 | 22.4 | 19.7 |
| Diluted EPS (\$) | 0.77 | 0.78 | 1.72 | 1.43 |
| ROAA (%) | 1.09 | 1.16 | 1.24 | 1.09 |
| ROAE (%) | 10.90 | 12.08 | 12.38 | 11.26 |
| Net Interest Margin (%) | 3.74 | 3.68 | 3.75 | 3.71 |
| Efficiency Ratio (%) | 58.91 | 59.43 | 57.70 | 60.00 |
| Book Value per Share (\$) | 28.30 | 26.00 | 28.30 | 26.00 |
| Tangible Book Value per Share (\$) | 26.19 | 23.98 | 26.19 | 23.98 |
| Community Bank Leverage Ratio (%) | 12.25 | 11.75 | 12.25 | 11.75 |
Conclusion: Investor Takeaways
Sierra Bancorp’s Q2 2026 report offers both reassurance and caution. The company is delivering improved profitability, efficient operations, robust capital and liquidity, and is actively managing expenses and share count. However, the earnings decline this quarter and the large credit event highlight the need for vigilance. The declared dividend and ongoing share repurchases provide direct shareholder returns, while management’s outlook for stronger loan growth in H2 could be a positive catalyst if realized.
Investors should monitor future credit risk developments, executive team changes, and the actual performance of the loan pipeline in the second half of 2026. The report contains several elements that could influence share price, including capital actions, dividend, and operational trends.
Disclaimer: This article is based on Sierra Bancorp’s unaudited financial report for Q2 and H1 2026. It is intended for informational purposes only and does not constitute investment advice. Investors should consider all relevant risk factors and consult their financial advisor before making investment decisions. Forward-looking statements are subject to risks and uncertainties as described in the company’s SEC filings.