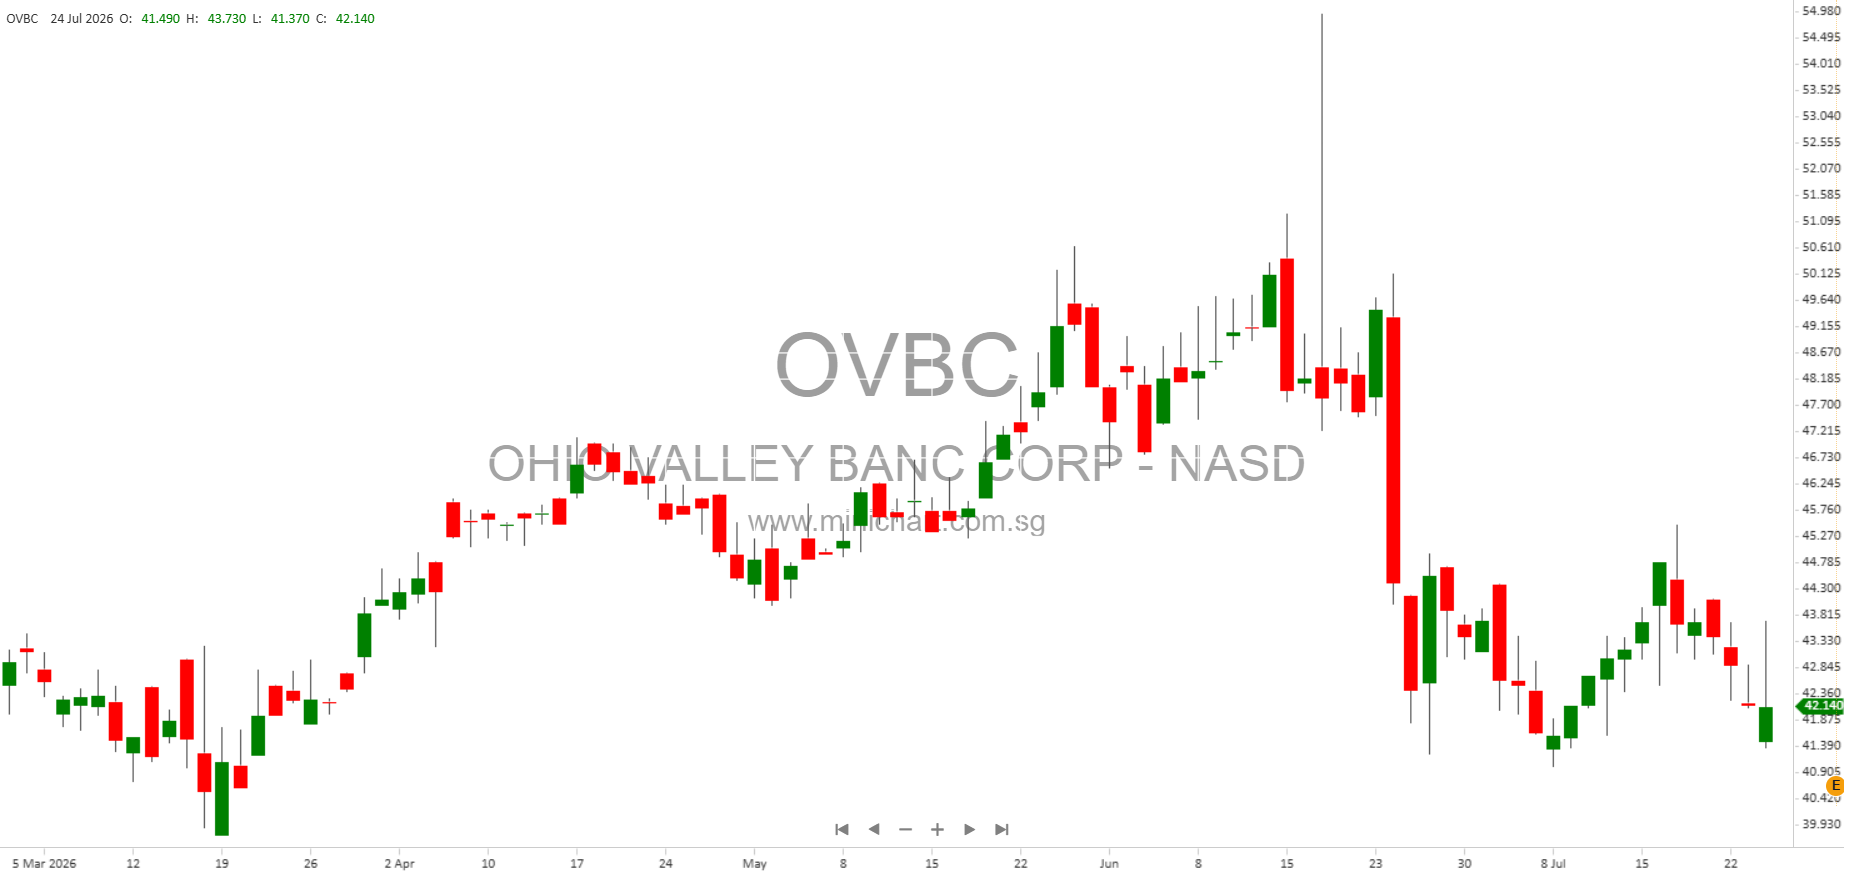
Ohio Valley Banc Corp Reports Q2 2026 Financial Results: Key Highlights and Analysis
Executive Summary
Ohio Valley Banc Corp (NASDAQ: OVBC) has released its unaudited financial results for the quarter and six months ended June 30, 2026. The report contains several noteworthy developments in the bank’s operational and financial performance, including net income trends, changes in asset yields, funding costs, and capital positions. These factors are important for investors, as they may have a significant impact on share valuation and shareholder returns going forward.
Key Financial Highlights
- Net Income: For the second quarter of 2026, OVBC reported a net income of \$2.93 million. This is a core measure of profitability and will be closely watched by both current and prospective shareholders.
- Earnings Per Share (EPS): EPS stood at \$0.62 for Q2 2026. For the six-month period, EPS was \$1.16. This is an important indicator for equity investors and a direct driver of share price performance.
- Dividend: The company declared a dividend of \$0.25 per share in the second quarter, with a year-to-date total of \$0.45 per share. The dividend payout ratio was reported at 24.61%, indicating continued commitment to returning value to shareholders.
- Book Value Per Share: Book value per share increased to \$36.80 as of June 30, 2026, compared to \$34.12 at the end of the prior year, reflecting growth in shareholder equity.
- Return on Average Equity (ROAE): ROAE was 11.30%, a key profitability metric.
- Return on Average Assets (ROAA): ROAA was 0.70%, indicating moderate asset profitability.
- Net Interest Margin (NIM): The fully tax-equivalent NIM (a measure of core banking profitability) was 3.06%.
- Total Assets: Total assets reached \$1.66 billion at June 30, 2026.
- Shareholders’ Equity: Total shareholders’ equity was \$173.4 million.
Detailed Operating Results and Analysis
Net Interest Income and Margin Developments
The bank’s net interest income for the six-month period ended June 30, 2026, was \$27.68 million. A significant driver of interest income growth was the strategic repositioning of the securities portfolio: OVBC sold \$36.9 million in low-yield securities (1.35%) and reinvested in higher-yielding options (4.52%), which improved overall interest income in 2026.
However, there was a contraction in net interest margin, primarily due to higher costs of funding. The composition of funding sources shifted toward higher-cost deposit products such as certificates of deposit and money market accounts, which were promoted to support loan growth and maintain liquidity. While the margin decreased, the overall increase in earning assets more than offset this effect, supporting net interest income.
Asset Quality and Loan Portfolio
- Net Loans: Net loans outstanding were \$1.23 billion as of June 30, 2026, after allowance for credit losses.
- Allowance for Credit Losses: The allowance for loan losses was \$16.61 million, up from \$11.52 million at year-end 2025, reflecting prudent risk management amid a changing credit environment.
- Provision for Credit Losses: Provision for credit losses for the six months was \$1.56 million, indicating some pressure in credit quality or portfolio growth.
Noninterest Income and Expense
- Noninterest Income: For the quarter, noninterest income was \$3.19 million, with key contributors including debit/credit card interchange income (\$2.43 million), mortgage banking income (\$675,000), and annuity asset income (\$242,000).
- Noninterest Expense: Total noninterest expense was \$11.25 million, with salaries and employee benefits being the largest component (\$3.31 million). The efficiency ratio (noninterest expense as a percentage of net interest income plus noninterest income) was 63.51%, highlighting the bank’s operational discipline.
Capital and Liquidity Position
- Deposits: Noninterest-bearing deposits were \$319.3 million and total deposits were \$1.33 billion, supporting the bank’s funding base.
- Borrowings: Other borrowed funds totaled \$41.8 million.
- Shareholders’ Equity: Increased to \$173.4 million driven by retained earnings and capital management.
- Book Value Per Share: As noted, \$36.80 per share, up from the prior year.
Forward-Looking Statements and Risks
The company’s management highlighted several forward-looking statements regarding economic conditions, competitive pressures, interest rate fluctuations, loan performance, regulatory changes, and other uncertainties. Shareholders should consider these risk factors as they may affect future results and share price performance.
Shareholder and Investor Takeaways
- Continued Profitability: OVBC continues to deliver steady profits and return value to shareholders through dividends and equity growth.
- Margin Pressure: Investors should note the contraction in net interest margin due to higher funding costs, which, if prolonged, could pressure future earnings.
- Stronger Asset Base: The bank’s active portfolio management and loan growth support a larger asset base, which can drive future earnings.
- Credit Quality: An increase in credit loss provisions and allowance may signal cautiousness or emerging risks in the loan book.
- Capital Strength: Book value per share and total equity are rising, supporting long-term shareholder value.
- Dividend Stability: The dividend payout remains healthy and sustainable, reinforcing the bank’s commitment to income-focused investors.
Conclusion
Ohio Valley Banc Corp’s Q2 2026 financial report demonstrates solid performance, with continued profitability, prudent capital management, and a strong balance sheet. Nonetheless, the margin compression and increased credit provisioning warrant investor attention. The report contains material information that could influence OVBC’s share price, particularly regarding earnings quality, dividend sustainability, and capital strength. Investors are advised to monitor the evolving interest rate environment, funding cost trends, and asset quality metrics in upcoming quarters.
Disclaimer: This article is for informational purposes only and does not constitute investment advice. Investors should consult with their financial advisor and review all company filings and disclosures before making investment decisions.