Healthcare Services Group, Inc. Reports Q2 2026 Financial Results: Detailed Investor Update
Key Highlights from the Q2 2026 Report
- Quarter Ended: June 30, 2026
- Ticker / Exchange: HCSG / Nasdaq Global Select Market
- Shares Outstanding (as of July 22, 2026): 68,632,202
- Total Assets: \$820.9 million (up from \$794.3 million as of December 31, 2025)
- Total Stockholders’ Equity: \$518.8 million (up from \$510.2 million as of December 31, 2025)
- Net Income (Q2 2026): \$22.7 million
- Net Income (YTD 2026): \$48.8 million
- Basic Earnings Per Share (Q2 2026): \$0.33
- Marketable Securities (Current): \$41.3 million
- Retained Earnings: \$332.4 million
Detailed Financial Performance
Balance Sheet Strength
Healthcare Services Group, Inc. (HCSG) reported significant growth in its asset base, with total assets rising to \$820.9 million as of June 30, 2026, compared to \$794.3 million at the end of the previous fiscal year. Stockholders’ equity also increased to \$518.8 million from \$510.2 million, reflecting retained earnings growth and continued profitability.
Profitability Metrics
- Q2 2026 Net Income: \$22.7 million
- Six-Month Net Income: \$48.8 million
- Basic Earnings per Share (EPS): \$0.33 for Q2 2026
- Retained Earnings: \$332.4 million (up from \$283.7 million at year-end 2025)
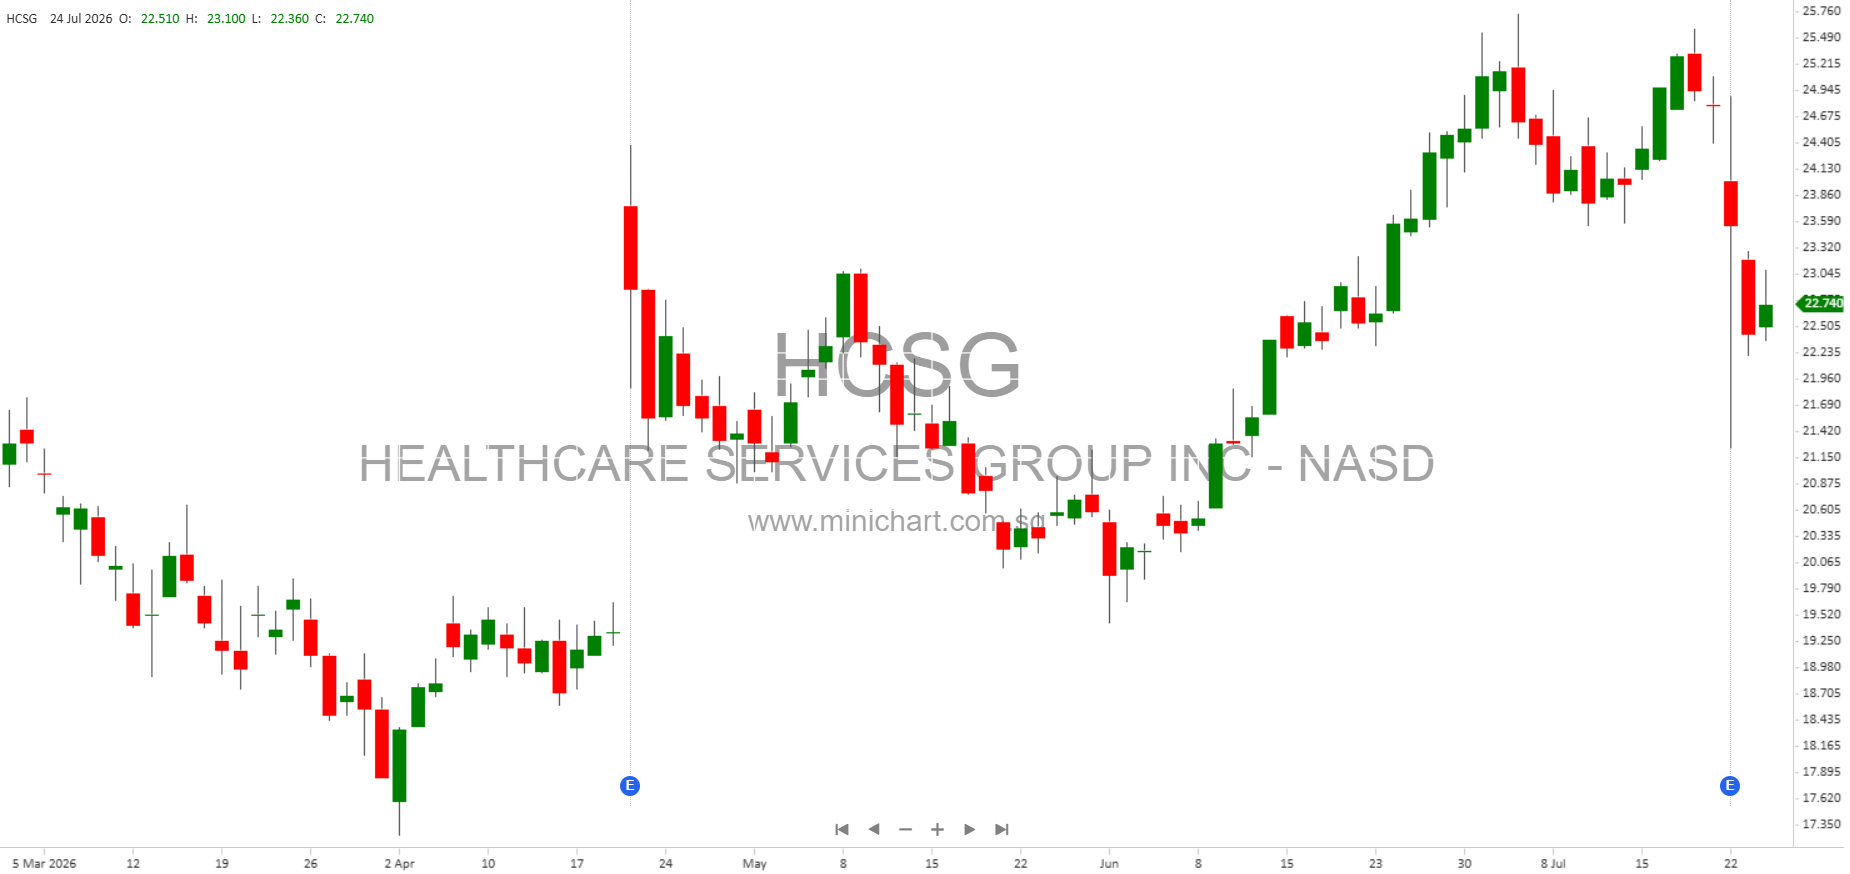
The company’s earnings power remains robust, with a strong improvement in net income compared to prior periods. The basic EPS of \$0.33 indicates sustained profitability, which could be seen as a positive catalyst for share prices.
Liquidity and Investments
- Marketable Securities (Current): \$41.3 million
- Restricted Marketable Securities: \$36.1 million
- Cash and Cash Equivalents: \$5.6 million
The company maintains a solid liquidity position, with a healthy balance in marketable and restricted securities. This liquidity provides strategic flexibility for growth initiatives or to withstand industry headwinds.
Capital Structure and Equity
- Shares Outstanding: 68.6 million
- Common Stock Value: \$773,000
- Additional Paid-in Capital: \$331.4 million
- Treasury Stock: (\$144.8 million)
The company continues to manage its capital structure conservatively, with treasury stock holdings indicating share buybacks or similar equity strategies.
Operating Performance & Segments
- Selling, General & Administrative Expense (Q2 2026): \$94.6 million
- Investment and Other Income (Q2 2026): \$9.4 million
While SG&A expenses remain significant, the company has benefited from robust investment and other income, contributing positively to the bottom line.
Strategic and Operational Commentary
- Growth Initiatives: Management believes that continued financial performance improvement will depend on acquiring new service agreements, retaining and expanding existing customer relationships, and achieving modest price increases. Operational efficiency and internal managerial development are also highlighted as critical for future success.
- Risk Factors: The company notes risks associated with its primary exposure to the healthcare and long-term care industry, including credit and collection risks and the impact of macroeconomic events such as bank failures and potential tariffs.
- Forward-Looking Statements: Management expresses caution regarding forward-looking statements, noting that no assurance can be given that growth and profitability targets will be met. Risks and uncertainties could impact future performance.
Potential Share Price Catalysts & Shareholder Considerations
- Strong Balance Sheet and Equity Growth: The increase in assets and stockholders’ equity, along with higher retained earnings, signal ongoing financial strength, which may positively influence investor sentiment and share price.
- Sustained Profitability: Consistent net income and EPS growth could prompt upward revisions in analyst estimates and attract additional investor interest.
- Liquidity and Investment Income: The company’s conservative liquidity profile and investment returns provide stability and flexibility, reducing risk in an uncertain macroeconomic environment.
- Risk Disclosure: Ongoing risks tied to the healthcare sector and broader economic factors remain relevant for investors, and any adverse developments could pressure the stock.
Conclusion
Healthcare Services Group, Inc.’s Q2 2026 report demonstrates continued financial strength with increases in assets, equity, and earnings. The company’s strong liquidity position, profitability, and prudent capital management are all positive signs for shareholders. However, investors should remain aware of sector-specific and macroeconomic risks that may impact future performance.
Disclaimer: This article is for informational purposes only and does not constitute investment advice. Investors should conduct their own analysis or consult a financial advisor before making investment decisions. All forward-looking statements are subject to risks, uncertainties, and changes in circumstances that may cause actual results to differ materially from those projected.