First Western Financial, Inc. (Nasdaq: MYFW) Delivers Strong Q2 2026 Results: Detailed Investor Analysis
Key Highlights from the Q2 2026 Investor Presentation
- Net income available to common shareholders: \$5.7 million for Q2 2026, up 119% year-over-year.
- Diluted earnings per share (EPS): \$0.57, a significant increase from \$0.26 in Q2 2025.
- Total assets: \$3.24 billion as of June 30, 2026.
- Total loans: \$2.71 billion; Total deposits: \$2.85 billion.
- Assets under management (AUM): \$7.28 billion.
- Tangible book value per share (TBV/share): Increased 2.6% quarter-over-quarter to \$25.53.
- Net interest margin (NIM): Rose to 2.90% in Q2 2026, up 9 basis points from the prior quarter.
- Non-performing assets ratio: Stable at 0.50%; Zero loan charge-offs for the second consecutive quarter.
- Efficiency ratio: 74.03% for Q2 2026, continuing improvement.
- Insider ownership: Approximately 13.1% of total shares outstanding, indicating significant alignment with shareholders.
Strategic Growth and Expansion
- Continued organic balance sheet growth and strategic M&A (notably Teton Financial Services acquisition), driving a 166% increase in loans and 153% increase in deposits since 2020.
- Geographic focus on high-growth, affluent markets in Colorado, Arizona, Wyoming, California, and Montana.
Denver-Aurora-Lakewood, CO remains the core market, holding 58% of total deposits. - Substantial market share gains in key MSAs:
- Aurora-Centennial, CO: Market share up from 0.77% (2022) to 1.33% (2025), a 73% increase.
- Fort Collins-Loveland, CO: Market share up from 2.20% (2022) to 3.80% (2025), a 73% increase.
- Boulder, CO: Market share up from 0.63% (2022) to 1.98% (2025), a 214% increase.
- Strong client relationship model underpinning a sticky, stable deposit base—even during periods of industry volatility.
- Strategic technology investments and modernization (EDGE program), including cloud migration, analytics, and unified operating platforms, enhancing operational efficiency and scalability.
Financial Performance and Momentum
- Net interest income: Increased for the seventh consecutive quarter to \$21.8 million, up 21.7% from Q2 2025.
- Non-interest income: \$6.4 million (22.7% of total revenue); minor decline QoQ due to lower mortgage origination and insurance fees, offset by higher bank fees.
- Loan portfolio: 1-4 family residential, non-owner occupied CRE, and owner-occupied CRE remain largest categories. Average CRE loan balance \$2.9 million; average LTV 55%.
- New loan production in Q2 2026: \$114.7 million, with an average rate of 6.37% (higher than previous cohort of payoffs).
- Total deposits: \$2.85 billion, up 0.4% sequentially and 12.6% year-over-year. Noninterest-bearing deposits increased 0.5% to \$381.8 million.
- Stable asset quality: ACL/Total loans at 0.75%; no charge-offs for second straight quarter; small provision release (\$0.5 million) reflecting improved credit outlook.
Competitive Positioning and Shareholder Value Drivers
- “Goldilocks” size – large enough for scale/leverage, small enough for agility and personalized service.
- Integrated, team-based approach; local, boutique trust bank offices with centralized product experts.
- Highly recurring, low-risk fee income from trust and investment management (TIM) activities, comprising a large share of overall revenue.
- Proven, stable management with a history of building and selling banks for substantial shareholder gains.
- Active M&A strategy will continue, with a disciplined focus on earnings accretion and minimal TBV dilution.
- Long-term goals include surpassing \$5 billion in total assets and \$25 billion in trust/investment management assets, with a continued emphasis on operating leverage and high returns on assets/equity.
- First Western was named one of 16 U.S. banks with industry-leading performance over the past decade.
Risks and Forward-Looking Considerations
- Geographic concentration in the Rocky Mountain region exposes the bank to local economic cycles and real estate values.
- Rising interest rates, changes in the economy, and competition for deposits/funding could impact margins and growth.
- Ongoing focus on risk management, conservative underwriting standards, and maintaining a strong core deposit base to mitigate risk.
Potentially Price-Sensitive Factors for Shareholders
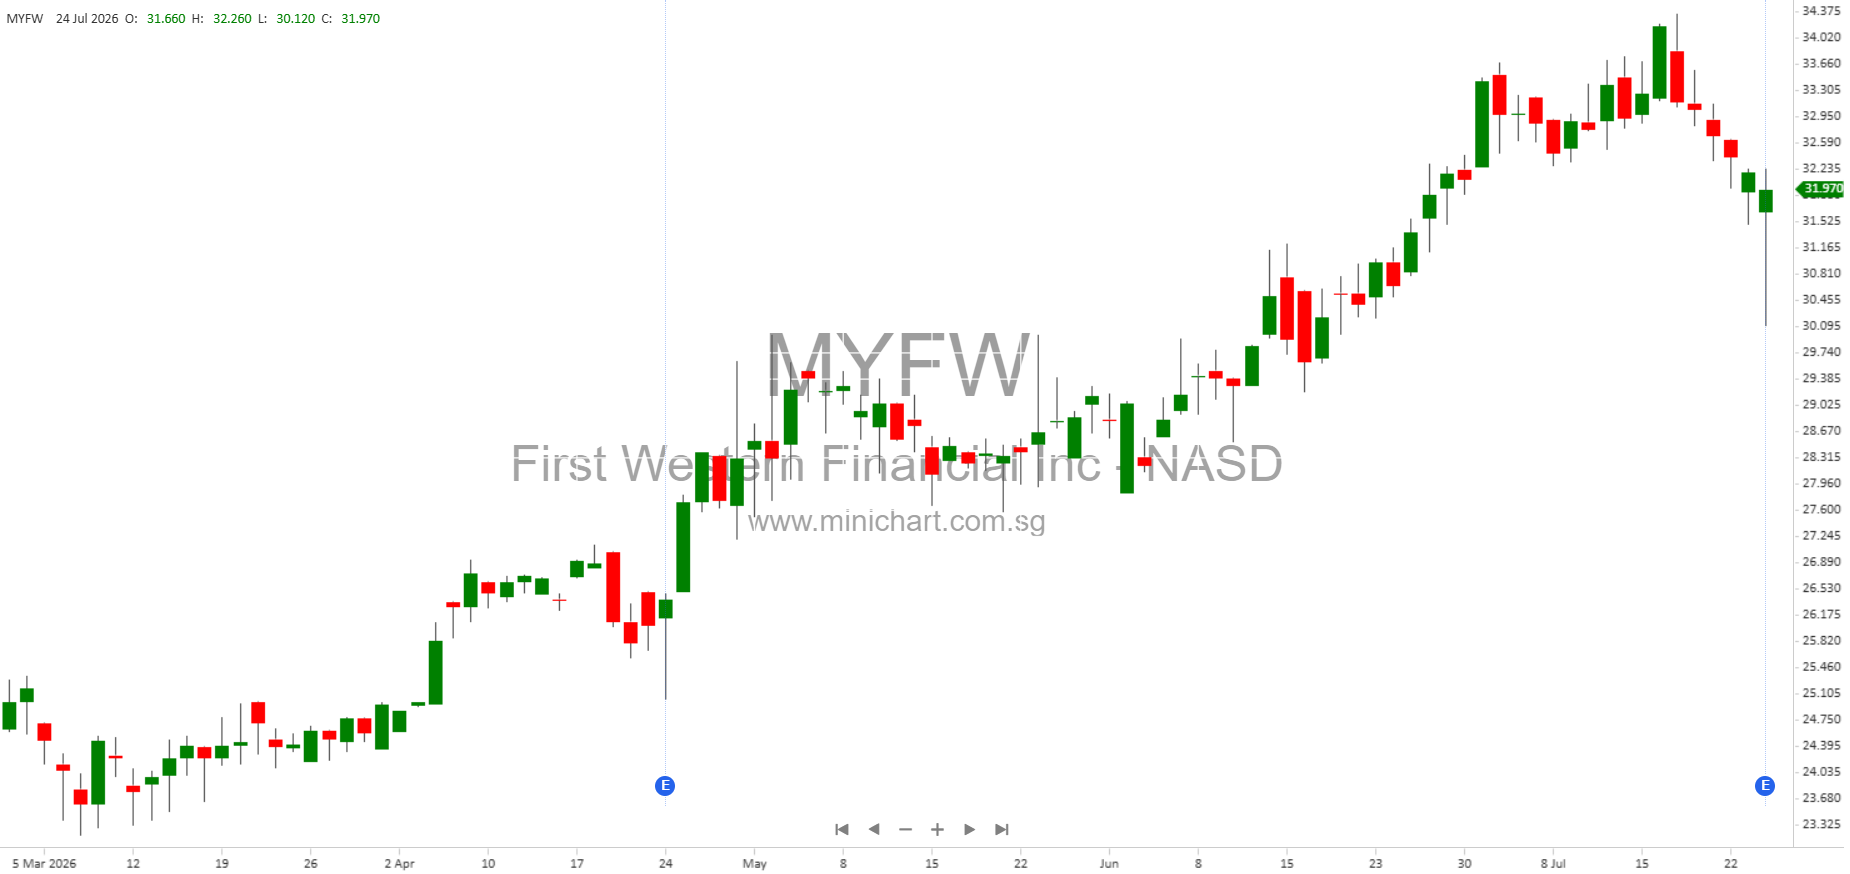
- Strong earnings momentum: The sharp increase in net income (up 119% YoY) and EPS (from \$0.26 to \$0.57) is likely to be viewed positively by the market.
- Consistent TBV/share growth and net interest margin expansion support the case for a higher valuation multiple.
- Low credit losses and stable asset quality, especially during a time of industry-wide stress, may attract further investor confidence.
- Active M&A and expansion strategy – history of successful, accretive acquisitions and office expansions enhances growth outlook.
- Discounted valuation: Shares are trading at 1.27x TBV (as of July 22, 2026), which could be attractive given the high returns and growth profile.
- High insider ownership aligns management and shareholder interests, potentially reducing agency risk.
Conclusion
First Western Financial, Inc. has reported another quarter of robust growth, operational efficiency, and stable credit quality. The bank’s unique market positioning in affluent Rocky Mountain regions, differentiated business model, and disciplined management team continue to drive strong financial performance and market share gains. With a proven track record, continued expansion, and improving profitability metrics, MYFW stands out as a compelling investment opportunity in the regional banking sector.
Disclaimer
This article is for informational purposes only and does not constitute investment advice. Investors should conduct their own due diligence or consult a financial advisor before making any investment decisions. Forward-looking statements are subject to risks and uncertainties as outlined in the company’s filings.