First Capital, Inc. Reports Robust Q2 and 1H 2026 Earnings; Key Metrics Improve Significantly
Highlights of the Report
- Q2 2026 net income: \$4.8 million, up 26% from \$3.8 million in Q2 2025
- Q2 2026 diluted EPS: \$1.43, compared to \$1.13 a year ago
- 1H 2026 net income: \$9.1 million, up from \$7.0 million in the first half of 2025
- 1H 2026 diluted EPS: \$2.72, compared to \$2.09 in 1H 2025
- Net interest margin (tax-equivalent, Q2): Improved to 3.98% from 3.59%
- Return on average assets (Q2 annualized): 1.49% vs. 1.24% prior year
- Return on average equity (Q2 annualized): 13.60% vs. 12.59% prior year
- Effective tax rate (Q2): 20.8% (higher YoY)
- Dividend increase: Q2 cash dividend up to \$0.31 from \$0.29 per share
- Balance sheet growth: Assets up to \$1.29 billion from \$1.27 billion at year-end 2025
In-Depth Financial Review
Quarter Ended June 30, 2026 vs. 2025
- Net Interest Income: Rose by \$1.6 million YoY, driven by both a higher average tax-equivalent yield on interest-earning assets (5.12% vs. 4.82%) and increased balance of those assets (\$1.24 billion vs. \$1.18 billion).
- Interest Expense: Decreased by \$93,000, with the average cost of interest-bearing liabilities declining to 1.56% (from 1.64%) despite an increase in the average balance of those liabilities to \$907.3 million (from \$883.8 million).
- Net Interest Margin (tax-equivalent): Increased to 3.98% from 3.59%.
- Provision for Credit Losses: Increased to \$425,000 from \$306,000. The rise reflects ongoing management assessment of the loan portfolio’s risk amid a higher balance in loans and unfunded commitments. Net charge-offs remained contained at \$58,000 (vs. \$113,000 prior year).
- Noninterest Income: Increased by \$187,000, largely due to a \$92,000 gain on equity securities (versus a \$41,000 loss a year ago) and a \$54,000 increase in service charges on deposit accounts. ATM and debit card fees also contributed positively.
- Noninterest Expenses: Rose by \$359,000, mainly attributable to:
- Compensation/benefits up \$235,000 (cost of living/performance adjustments, higher health insurance costs)
- Advertising up \$84,000 (new marketing campaigns)
- Other expenses up \$79,000 (inflationary pressures, pricing increases)
- Partially offset by a \$75,000 reduction in professional services (fewer consulting fees)
- Income Tax Expense: Up \$397,000, with the effective tax rate rising to 20.8% from 18.4%, reflecting more income subject to taxation.
First Half Ended June 30, 2026 vs. 2025
- Net Interest Income after Provision for Credit Losses: Up \$3.4 million YoY.
- Interest Income: Increased by \$3.2 million, driven by both higher yields and balances.
- Interest Expense: Fell by \$352,000, as the cost of interest-bearing liabilities dropped to 1.56% (from 1.67%) even as balances rose.
- Net Interest Margin (tax-equivalent): Improved to 3.90% from 3.47%.
- Provision for Credit Losses: Rose to \$775,000 from \$644,000. Net charge-offs decreased to \$169,000 from \$197,000.
- Noninterest Income: Increased by \$387,000, primarily from a \$270,000 gain on equity securities (vs. a \$23,000 loss), \$70,000 higher ATM/debit fees, and a \$53,000 increase in service charges. Offset by a \$92,000 loss on sale of securities (vs. \$55,000 prior-year loss), as \$18.7 million of securities were sold to reposition the portfolio for better yields.
- Noninterest Expenses: Up \$931,000, with drivers including:
- Compensation/benefits up \$470,000
- Other expenses up \$178,000 (notably consumer fraud losses and greater community sponsorships/donations)
- Professional services up \$166,000 (increased consulting fees)
- Advertising up \$82,000
- Income Tax Expense: Increased by \$755,000, with the effective tax rate rising to 20.0% (from 17.9%), again due to a higher proportion of income subject to tax.
Balance Sheet & Capital Highlights
- Total assets: \$1.29 billion at June 30, 2026 (up from \$1.27 billion at 2025 year-end).
- Net loans receivable: Increased by \$14.0 million since year-end 2025.
- Cash and cash equivalents: Up \$12.5 million.
- Available for sale securities: Down \$10.3 million (reflecting portfolio repositioning).
- Deposits: Up by \$13.7 million to \$1.14 billion.
- Nonperforming assets: Increased to \$4.9 million from \$4.4 million at year-end, though still low relative to asset base.
- Allowance for Credit Losses: 1.58% of gross loans (up from 1.52%).
- Community Bank Leverage Ratio: 11.34%, indicating strong capital position.
Key Items for Shareholders & Potential Price Sensitivity
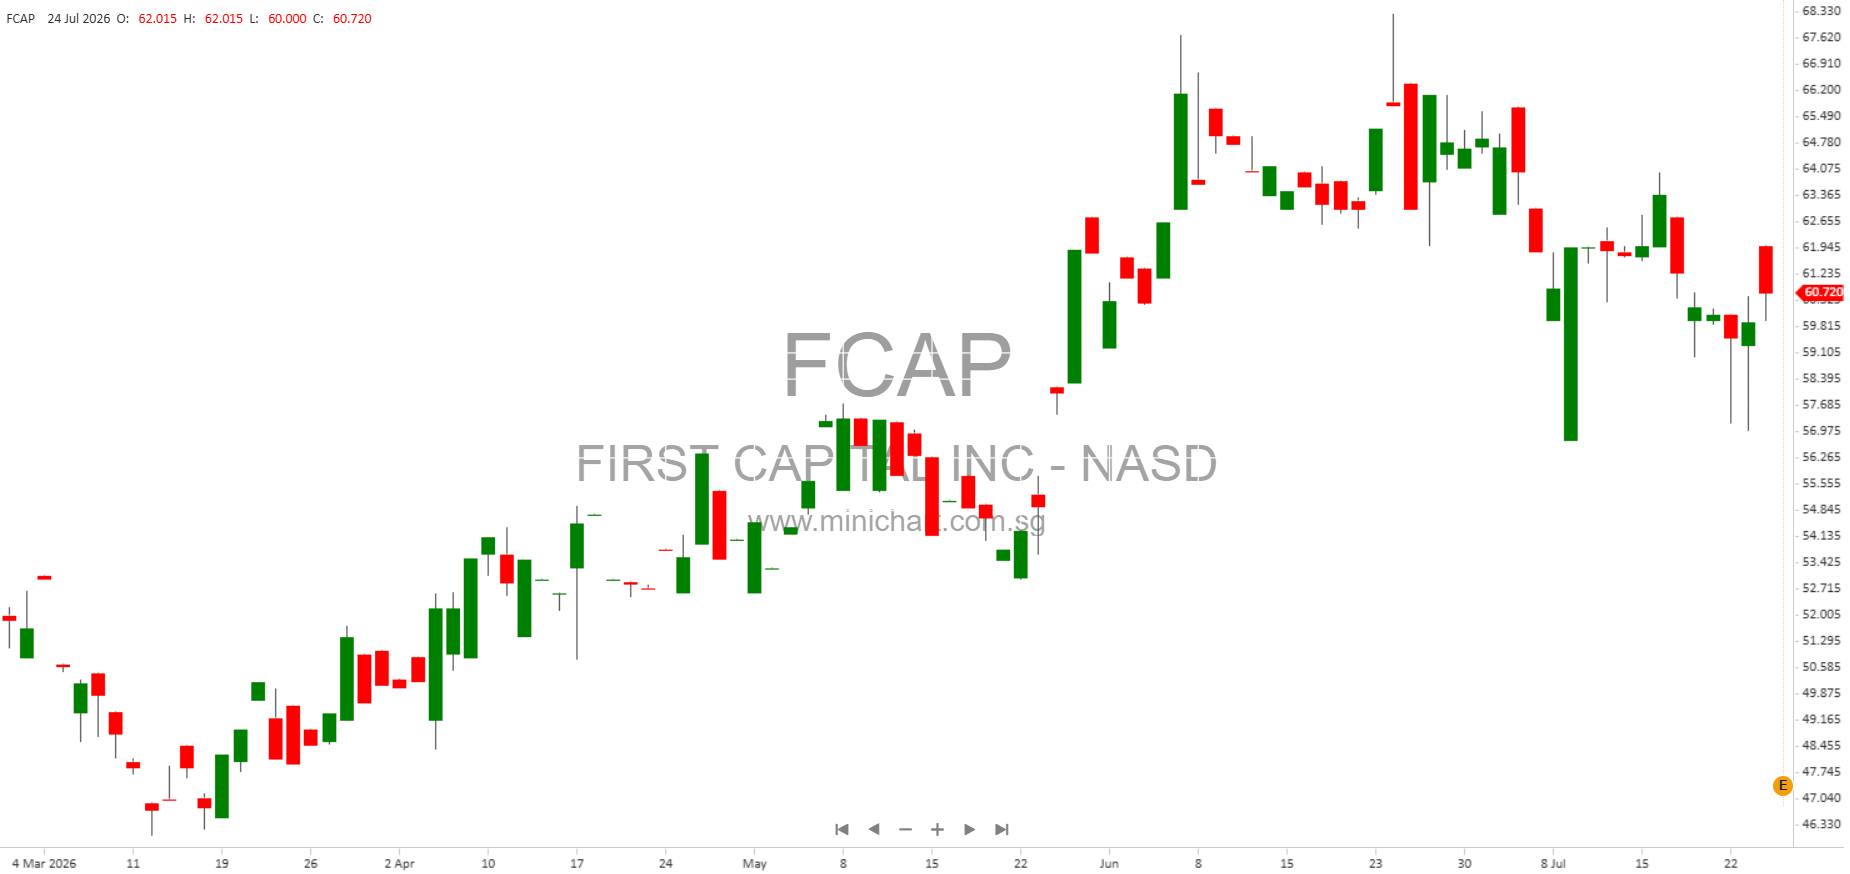
- Material improvement in profitability: Both quarterly and half-year EPS and net income rose sharply, with significant expansion in net interest margins and returns on assets/equity. These improvements are typically price-positive and may drive share value higher.
- Dividend Increase: The quarterly dividend was raised to \$0.31 per share from \$0.29 (and the half-year payout to \$0.62 from \$0.58), signaling confidence in sustained profitability and capital strength.
- Balance Sheet Growth: Ongoing growth in loans, deposits, and cash shows organic franchise strength.
- Credit Quality & Risk: While provisions for credit losses and nonperforming assets increased modestly, net charge-offs remain low and the allowance is robust. However, continued increases would warrant monitoring.
- Operational Investments: Higher operating expenses are largely due to investments in people (compensation, health insurance) and marketing, as well as inflationary effects. These are manageable in context of rising revenues but should be watched.
- Tax Rate: Effective tax rates have moved higher, which modestly offsets bottom-line gains but also reflects higher taxable income—a positive underlying trend.
- Portfolio Repositioning: The sale of \$18.7 million in securities (with a realized loss) to increase future yields could improve future net interest income, though it is a short-term profitability drag.
- Capital Position: The 11.34% Community Bank Leverage Ratio indicates the bank is well-capitalized.
About First Capital, Inc. and First Harrison Bank
The company operates 17 offices in southern Indiana and northern Kentucky and offers robust online and mobile banking platforms. Its continued growth in loans and deposits, along with a strong capital position, demonstrates ongoing franchise strength.
Forward-Looking Statements
The company cautions that forward-looking statements are subject to risks including economic trends, interest rate changes, regulatory developments, competition, and other factors detailed in SEC filings.
Contact
Joshua P. Stevens
Chief Financial Officer
812-738-1570
Disclaimer: This article is a summary and analysis of First Capital, Inc.’s earnings report, intended for informational purposes only. It does not constitute investment advice. Investors should consult the company’s official filings and their financial advisors before making investment decisions. While the article highlights potentially price-sensitive information, market reactions can be unpredictable and are influenced by a variety of external factors.