SLM Corporation Q2 2026 Earnings Report: Key Highlights and Investor Analysis
Summary of Financial Performance
- Quarter Ended: June 30, 2026
- Common Stock Shares Outstanding: 416,958,000 shares
- Exchange: The NASDAQ Global Select Market (Symbol: SLM)
- Filer Status: Large Accelerated Filer
- Company is not a shell company or emerging growth company
Balance Sheet Overview
| Assets | June 30, 2026 | December 31, 2025 |
|---|---|---|
| Cash and Cash Equivalents | \$4,588,129,000 | \$4,241,265,000 |
| Total Investments | \$1,879,738,000 | \$1,922,714,000 |
| Restricted Cash | \$206,858,000 | \$177,263,000 |
| Total Assets | \$28,579,411,000 | \$29,746,295,000 |
Equity and Shareholder Information
- Preferred Stock Outstanding: \$251,070,000
- Common Stock Value: \$89,138,000
- Retained Earnings: \$5,041,088,000 (up from \$4,734,313,000)
- Total Stockholders’ Equity: \$2,474,669,000
- Treasury Stock: 257.7 million shares held in treasury, valued at \$4,124,583,000
Income Statement Highlights
| Item | Q2 2026 (3 Months) | Q2 2025 (3 Months) | YTD 2026 (6 Months) | YTD 2025 (6 Months) |
|---|---|---|---|---|
| Total Interest Income | \$602,055,000 | \$656,759,000 | \$1,251,364,000 | \$1,312,849,000 |
| Interest Expense | \$269,939,000 | \$282,407,000 | \$543,132,000 | \$561,059,000 |
| Net Interest Income | \$332,821,000 | \$376,820,000 | \$708,232,000 | \$751,790,000 |
| Provisions for Credit Losses | \$148,718,000 | \$98,718,000 | \$114,197,000 | \$107,197,000 |
| Net Interest Income After Provisions | \$207,158,000 | \$228,102,000 | \$594,035,000 | \$644,593,000 |
Key Points for Investors
- Decrease in Total Assets: SLM’s total assets decreased from \$29.7 billion at year-end 2025 to \$28.6 billion at Q2 2026. This may signal tighter management of balance sheet or asset sales.
- Increase in Cash and Cash Equivalents: Cash rose by \$347 million, which could indicate improved liquidity or capital preservation.
- Decline in Interest Income: Total interest income for both Q2 and year-to-date 2026 is lower than the corresponding periods in 2025, which may reflect slower loan growth or lower rates.
- Provision for Credit Losses Up Sharply: Provisions for credit losses have increased substantially in Q2 2026 compared to Q2 2025, which may indicate higher expected defaults or deteriorating loan quality.
- Net Interest Income After Provisions Down: This key profitability metric is down year-over-year, which may impact future earnings prospects and dividend coverage.
- Retained Earnings Growth: Despite a slower earnings pace, retained earnings increased, suggesting continued profitability.
- Large Treasury Stock Position: SLM continues to hold a significant amount of shares in treasury, which may affect share count and EPS calculations. This could also point to ongoing share buybacks.
Potential Price-Sensitive Items
- Increase in Credit Loss Provisions: The rise in credit loss provisions is a potential red flag. If loan quality continues to deteriorate, future earnings may be impacted. Investors should watch for management commentary on credit trends and reserve adequacy.
- Decrease in Net Interest Income: The reduction in net interest income, particularly after credit provisions, may signal earnings pressure. This could influence investor sentiment and share price.
- Share Buybacks: The large number of shares held in treasury (\$4.1 billion value) may point to ongoing share repurchase programs. While this can support EPS, it is important to monitor whether buybacks are sustainable given asset and earnings trends.
- Liquidity Improvement: The increase in cash and cash equivalents may be viewed positively by the market, especially if SLM is preparing for uncertain credit conditions.
Other Noteworthy Disclosures
- Regulatory Compliance: SLM has filed all required SEC reports and submitted all Interactive Data Files as required.
- Filer Status: SLM is a large accelerated filer and not an emerging growth company or shell company.
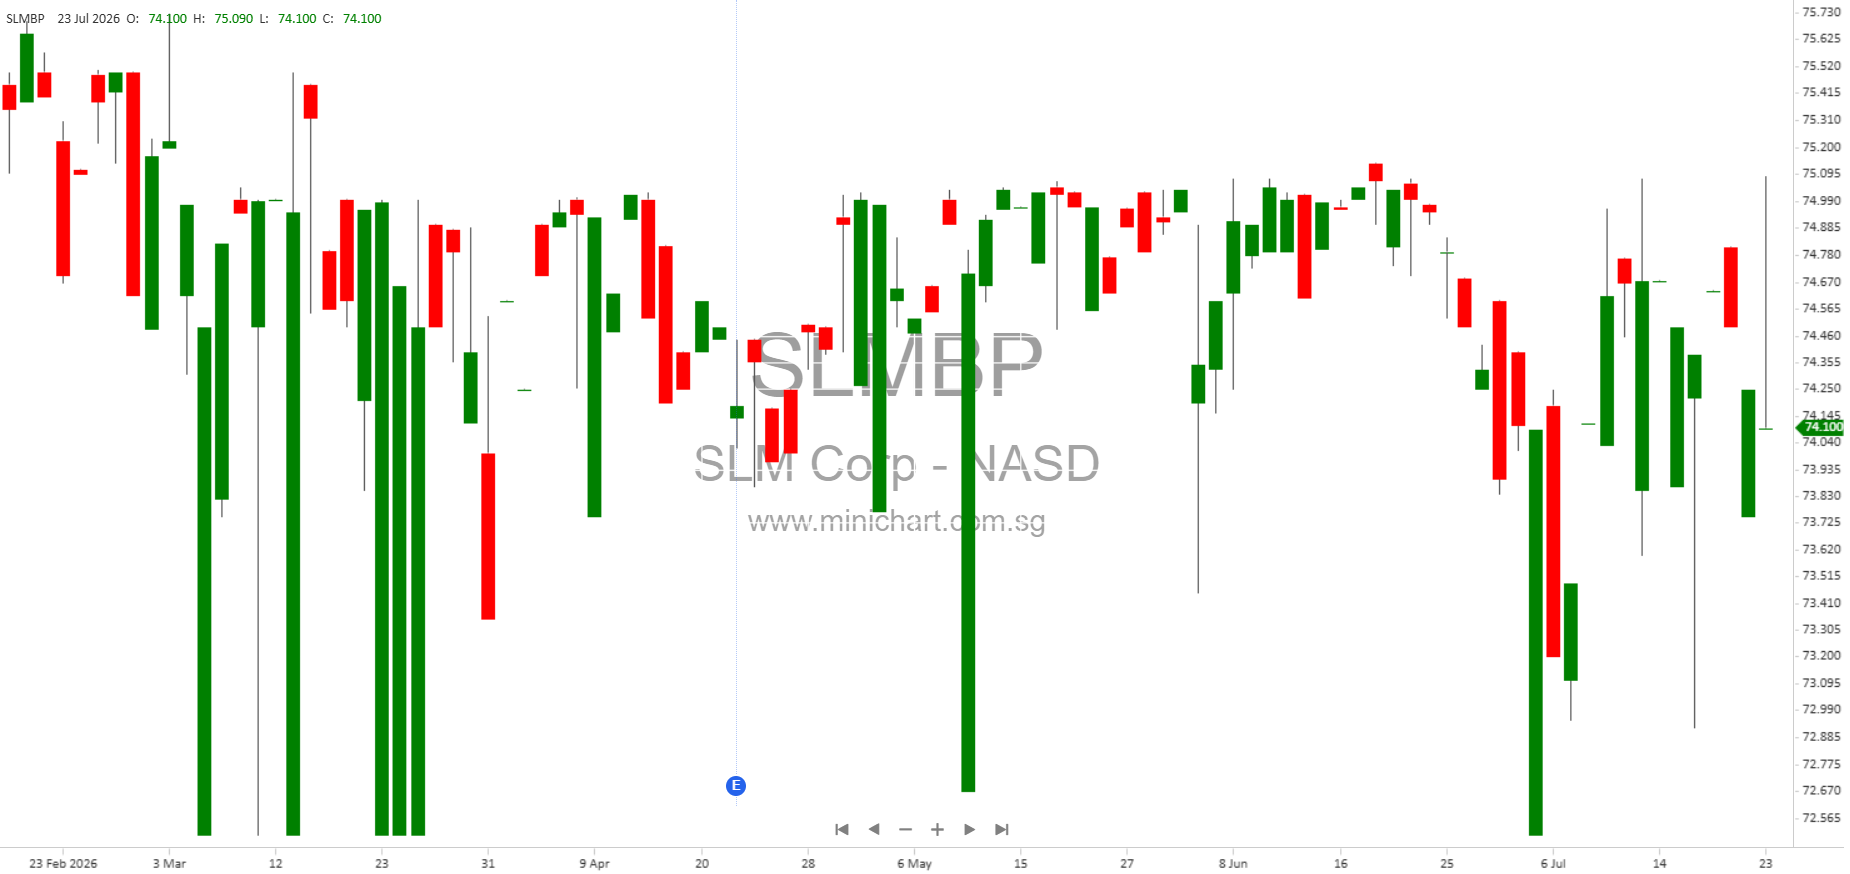
- Preferred Stock: Series B preferred stock remains outstanding and listed on NASDAQ (Symbol: SLMBP).
Conclusion
SLM Corporation’s Q2 2026 financial report reveals a mixed picture for investors. Key positives include improved liquidity and growing retained earnings. However, the increase in credit loss provisions and decrease in net interest income post-provision raise concerns about loan quality and future profitability. The company’s continued share buyback activity may support the share price in the short term, but investors should closely monitor credit quality trends and management’s guidance.
Disclaimer
This article is intended for informational purposes only and does not constitute investment advice. All financial data is based on the company’s official SEC filings for the period ended June 30, 2026. Investors should conduct their own due diligence and consult with financial advisors before making any investment decisions. The author assumes no responsibility for any loss arising from the use of this information.