Quest Diagnostics Reports Strong Q2 2026 Results: Key Highlights for Investors
Overview and Key Financial Results
Quest Diagnostics Incorporated (NYSE: DGX) has released its quarterly report for the period ended June 30, 2026. The company continues to demonstrate solid operational and financial performance, maintaining its position as a leading provider in the diagnostics industry.
- Net Revenues: The company reported net revenues of \$2,495 million for Q2 2026.
- Operating Income: Operating income reached \$459 million for the quarter, up from \$438 million in Q2 2025.
- Net Income: Net income attributable to Quest Diagnostics was \$334 million for Q2 2026, compared to \$296 million in the same period last year.
- Earnings Per Share (EPS): Basic EPS for the quarter was \$2.88, up from \$2.51 in Q2 2025. Diluted EPS was \$2.84, up from \$2.47 last year. For the six months ended June 30, 2026, basic EPS was \$5.15 and diluted EPS was \$5.08.
- Comprehensive Income: Comprehensive income for Q2 2026 was \$315 million, compared to \$363 million in Q2 2025.
- Cash Flow: Net cash provided by operating activities for the six months ended June 30, 2026 was \$1,127 million, compared to \$1,067 million for the same period last year.
- Share Count: As of July 15, 2026, there were 373,360,000 shares of common stock outstanding.
Balance Sheet Highlights
- Total Assets: \$16,939 million as of June 30, 2026.
- Total Liabilities: \$9,120 million.
- Total Stockholders’ Equity: \$7,819 million, up from \$7,206 million at December 31, 2025.
Segment and Operational Information
- Quest Diagnostics operates as a single reportable segment.
- The company continues to invest in its core diagnostic information services business, with ongoing expansion in both testing capabilities and geographic reach.
- Investments in equity method investees stood at \$137 million as of June 30, 2026.
Shareholder Considerations and Potential Price-Sensitive Information
- Strong Earnings Growth: The year-over-year increase in revenue, operating income, and net income signals robust demand and operational efficiency, which could positively affect share value.
- EPS Growth: Both basic and diluted EPS have increased compared to the prior year, a key metric for investor confidence and potential stock price appreciation.
- Dividend Payments: The company paid \$184 million in dividends during the first half of 2026, demonstrating ongoing commitment to returning capital to shareholders.
- No Share Repurchases: Notably, there were no stock repurchases in the period, which may be relevant for investors tracking buyback activity as a driver of EPS growth.
- Solid Cash Flow: The increase in operating cash flow supports the company’s ability to fund operations, invest in growth initiatives, and maintain dividend payments.
Corporate Structure and Regulatory Status
- Quest Diagnostics remains a large accelerated filer and is not a shell company. The company is not classified as an emerging growth company or a smaller reporting company.
- Shares are traded under the symbol DGX on the New York Stock Exchange.
- The company has been in compliance with all SEC filing requirements and Interactive Data File submissions for the preceding 12 months.
Potential Risks and Forward-Looking Considerations
- While the report does not highlight specific risks, investors should monitor ongoing general and administrative expense trends and any material developments in the regulatory or reimbursement environment that could impact future results.
- Given the company’s strong balance sheet and cash flow, Quest Diagnostics appears well-positioned to pursue strategic initiatives and withstand potential market volatility.
Conclusion
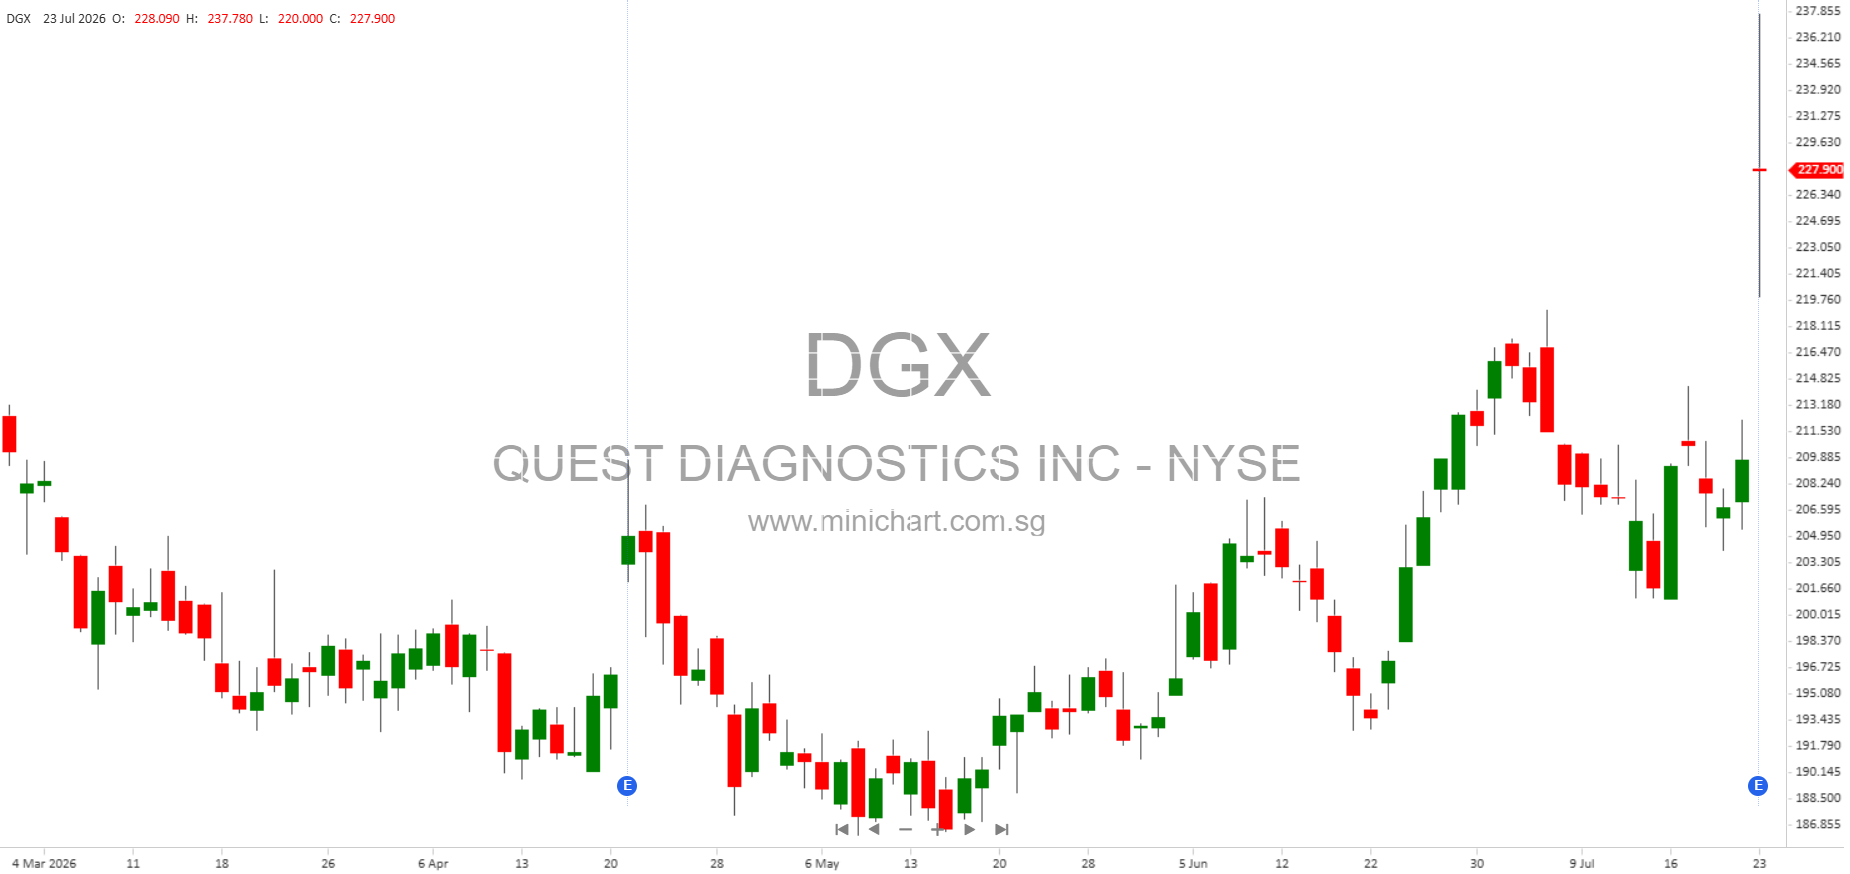
Quest Diagnostics’ Q2 2026 results reflect a strong operational and financial performance, with growth across key metrics such as revenues, earnings, and cash flow. The company’s ongoing investment in its core business and its commitment to shareholder returns via dividends support a positive outlook. These results are likely to be viewed favorably by the market and may contribute to share price appreciation, especially given the year-over-year improvement in EPS and net income.
Disclaimer: This article is for informational purposes only and does not constitute investment advice. Investors should review the full SEC filings and consult with a financial advisor before making investment decisions. Past performance is not indicative of future results.