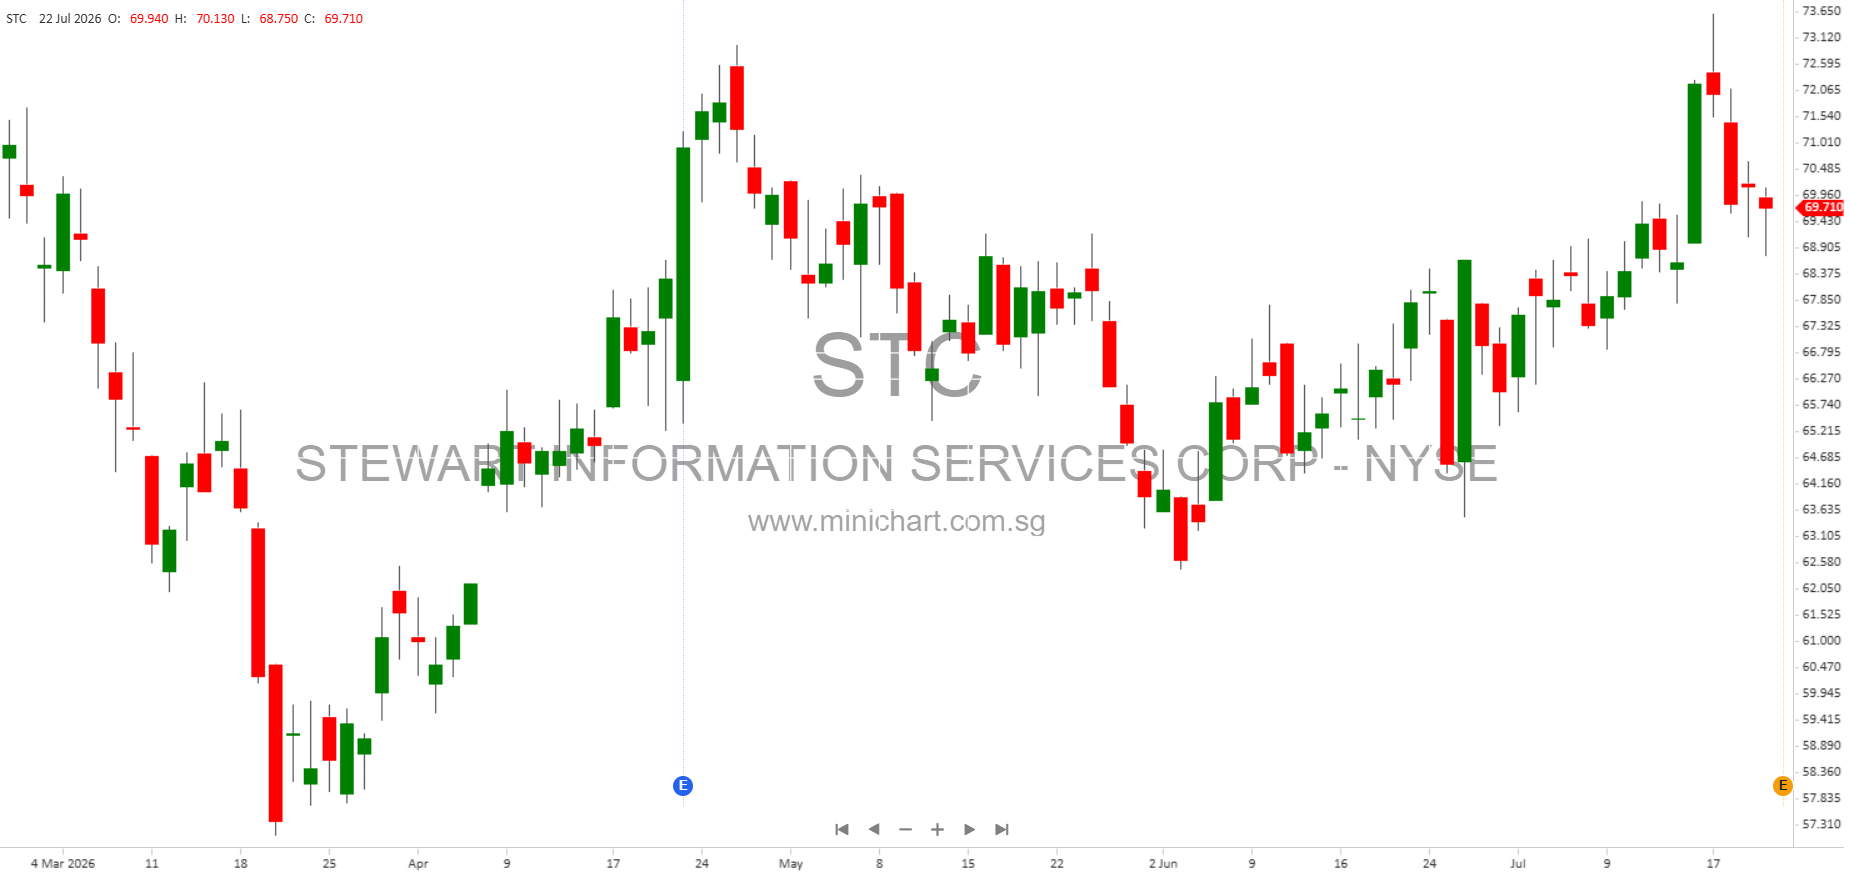
Stewart Information Services Corp. (NYSE: STC) Announces Strong Q2 2026 Results
Key Financial Highlights
- Total Revenues: \$899.2 million (\$895.8 million adjusted), up 25% from \$722.2 million (\$721.5 million adjusted) in Q2 2025.
- Net Income: \$37.2 million (\$42.9 million adjusted), up 17% from \$31.9 million (\$38.0 million adjusted) in Q2 2025.
- Diluted EPS: \$1.21 (\$1.39 adjusted), compared to \$1.13 (\$1.34 adjusted) last year.
- Pretax Income: \$55.1 million (\$62.8 million adjusted), up from \$46.8 million (\$54.9 million adjusted) in Q2 2025.
- Pretax Margin: 6.1% (7.0% adjusted), versus 6.5% (7.6% adjusted) last year.
- Net Cash Provided by Operations: \$60.5 million, up from \$53.4 million in Q2 2025.
Segment Performance
Title Segment
- Operating Revenues: \$683.6 million, up 15% year over year.
- Direct Title Revenues: \$306.6 million, up 5% (driven by a 20% increase in domestic commercial revenues).
- Agency Title Revenues: \$377.0 million, up 25% gross and 26% net of agency retention.
- Commercial Transaction Volume: Domestic commercial closed orders increased 21%, while average fee per file held steady at \$16,900.
- Residential Fee Per File: Improved 10% to \$3,200.
- International Revenues: Up 5% due to higher transaction volumes.
- Operating Expenses: Employee costs and other operating expenses up 11%, but as a percentage of operating revenues improved from 47% to 45%.
- Title Loss Expense: Improved to 3.2% of operating revenues, from 3.6% last year.
- Investment Income: Down 9% due to lower interest rates and escrow balances.
- Pretax Income: \$48.6 million, down 1%, with adjusted pretax income at \$47.9 million (down 8%).
Real Estate Solutions (RES) Segment
- Revenues: \$197.4 million, up 75% (driven by acquisition of MCS business and growth in credit information and valuation services).
- Pretax Income: \$18.5 million, up 174%.
- Adjusted Pretax Income: \$26.8 million, up 119%.
- Pretax Margin: 9.4% (13.6% adjusted), versus 6.0% (10.9% adjusted) last year.
- Operating Expenses: Employee costs and other operating expenses up 71% due to higher service costs and increased employee count.
- Integration Costs: Second quarter 2026 adjustments included MCS integration costs.
Corporate Segment
- Net Expenses: Increased to \$12.0 million from \$9.2 million, primarily due to higher interest expense on increased debt balances.
Consolidated Expense Highlights
- Employee Costs: Up \$32.9 million (16%) due to higher salaries, benefits, and incentive compensation tied to improved results. Average employee count increased 17%.
- Other Operating Expenses: Up \$67.5 million (39%), mainly from real estate solutions service expenses and title outside service fees.
- Operating Expenses Ratio: Employee costs as a percentage of operating revenues improved to 27.4% from 29.5%, while other operating expenses increased to 27.4% from 24.6%.
Balance Sheet and Book Value
- Total Assets: \$3.29 billion as of June 30, 2026, up from \$3.25 billion at year-end 2025.
- Cash & Cash Equivalents: \$261.6 million.
- Stockholders’ Equity: \$1.67 billion.
- Book Value Per Share: \$54.63, up from \$54.30 at year-end 2025.
- Notes Payable (Debt): \$646.7 million.
Order Activity
- Domestic Commercial Orders: Opened Q2 2026: 6,003; Closed Q2 2026: 5,324 (up from 4,526 opened and 4,415 closed in Q2 2025).
- Purchase Orders: Opened Q2 2026: 51,151; Closed Q2 2026: 35,870.
- Refinancing Orders: Opened Q2 2026: 20,182; Closed Q2 2026: 13,176.
- Other Orders: Opened Q2 2026: 15,211; Closed Q2 2026: 6,939.
- Total Orders: Opened Q2 2026: 92,547; Closed Q2 2026: 61,309 (compared to 89,646 opened and 66,594 closed in Q2 2025).
Non-GAAP Adjustments
- Adjusted revenues, pretax income, net income, and EPS exclude net realized/unrealized gains, acquired intangible asset amortization, acquisition integration, office closure, and severance expenses.
- Adjusted diluted EPS: \$1.39 for Q2 2026 vs. \$1.34 in Q2 2025.
- Adjusted net income: \$42.9 million for Q2 2026 vs. \$38.0 million in Q2 2025.
- Management emphasizes these as core profitability measures.
Management Commentary
“We continued to build on our momentum in the second quarter and delivered another quarter of strong revenue results. Though the housing market faces continued headwinds, we remain dedicated to growing each of our businesses and delivering best-in-class service to our customers.”
– Fred Eppinger, Chief Executive Officer
Potential Price Sensitive Information
- Significant revenue and net income growth, especially in the Real Estate Solutions segment (up 75% in revenue, 174% in pretax income).
- Impact from the MCS acquisition and successful integration, contributing to RES segment’s outperformance.
- Improved expense ratios and higher average fee per residential file (up 10%) signal operational efficiency.
- Commercial transaction volume up 21% in closed orders, with steady fee per file (suggesting robust demand in commercial real estate).
- Increase in debt and corporate expenses may warrant attention for future interest expense impact.
- Book value per share continues to rise, reflecting strengthening financial position.
- Forward-looking statements highlight potential risks related to economic conditions, tariffs, trade restrictions, and real estate activity volatility.
Conference Call Details
Stewart will host a conference call to discuss second quarter 2026 earnings on July 23, 2026, at 8:30 a.m. Eastern Time. Participation details are available via Stewart’s Investor Relations website.
About Stewart Information Services Corp.
Stewart is a global real estate services company providing title insurance, closing, settlement services, and specialized offerings for the mortgage and real estate industries through its direct operations and network.
Disclaimer
This article is for informational purposes only and does not constitute investment advice. All forward-looking statements are subject to risks and uncertainties, including those detailed in Stewart’s filings with the Securities and Exchange Commission. Investors are advised to review official filings and consult with financial advisors before making any investment decisions.