Freeport-McMoRan Q2 2026 Earnings Report: Comprehensive Investor Update
Strong Operational Performance and Financial Results
Freeport-McMoRan Inc. (NYSE: FCX) reported robust results for the second quarter and first half of 2026, highlighting significant operational execution and favorable market conditions. Key points include:
- Consolidated copper sales: Q2 sales of 710 million pounds, exceeding April estimates of 690 million pounds, primarily due to improved operating performance and shipment timing. However, sales were lower than Q2 2025 (1.0 billion pounds), reflecting reduced operating rates at PT Freeport Indonesia (PTFI) during the phased ramp-up of the Grasberg Block Cave underground mine.
- Gold sales: Q2 2026 sales of 123 thousand ounces, slightly below the April estimate (140k ounces) due to shipment timing in Indonesia and below Q2 2025 (522k ounces).
- Molybdenum sales: Q2 2026 sales of 25 million pounds, above both April estimates and Q2 2025 sales, benefiting from inventory reductions.
- Production volumes: Q2 2026 production: 786 million pounds copper, 192 thousand ounces gold, 23 million pounds molybdenum.
- Financials: Q2 2026 net income attributable to common stock: \$984 million (\$0.68/share), up from \$772 million (\$0.53/share) in Q2 2025. Adjusted net income excluding \$96 million after-tax charges (mainly for idle facility/restoration costs from PTFI’s September 2025 mud rush incident): \$1.1 billion (\$0.74/share).
- Revenues: \$7.03 billion in Q2 2026 (\$13.26 billion for first half), down from \$7.58 billion in Q2 2025 (\$13.31 billion first half 2025).
- Operating cash flow: Q2 2026: \$2.05 billion; first half: \$3.54 billion. Full-year 2026 forecast: \$8.3 billion, net of \$0.3 billion working capital and other uses, assuming copper at \$6.00/lb, gold at \$4,000/oz, molybdenum at \$30/lb for the second half.
- Capital expenditures: Q2 2026: \$1.1 billion; first half: \$2.08 billion; full-year estimate: \$4.3 billion, including \$3.0 billion for major mining projects (notably the Grasberg underground development and El Abra leaching project).
- Net debt: As of June 30, 2026, net debt was \$2.1 billion (excluding \$3.2 billion project debt for PTFI downstream processing facilities). Total consolidated debt: \$9.4 billion; cash and equivalents: \$4.1 billion.
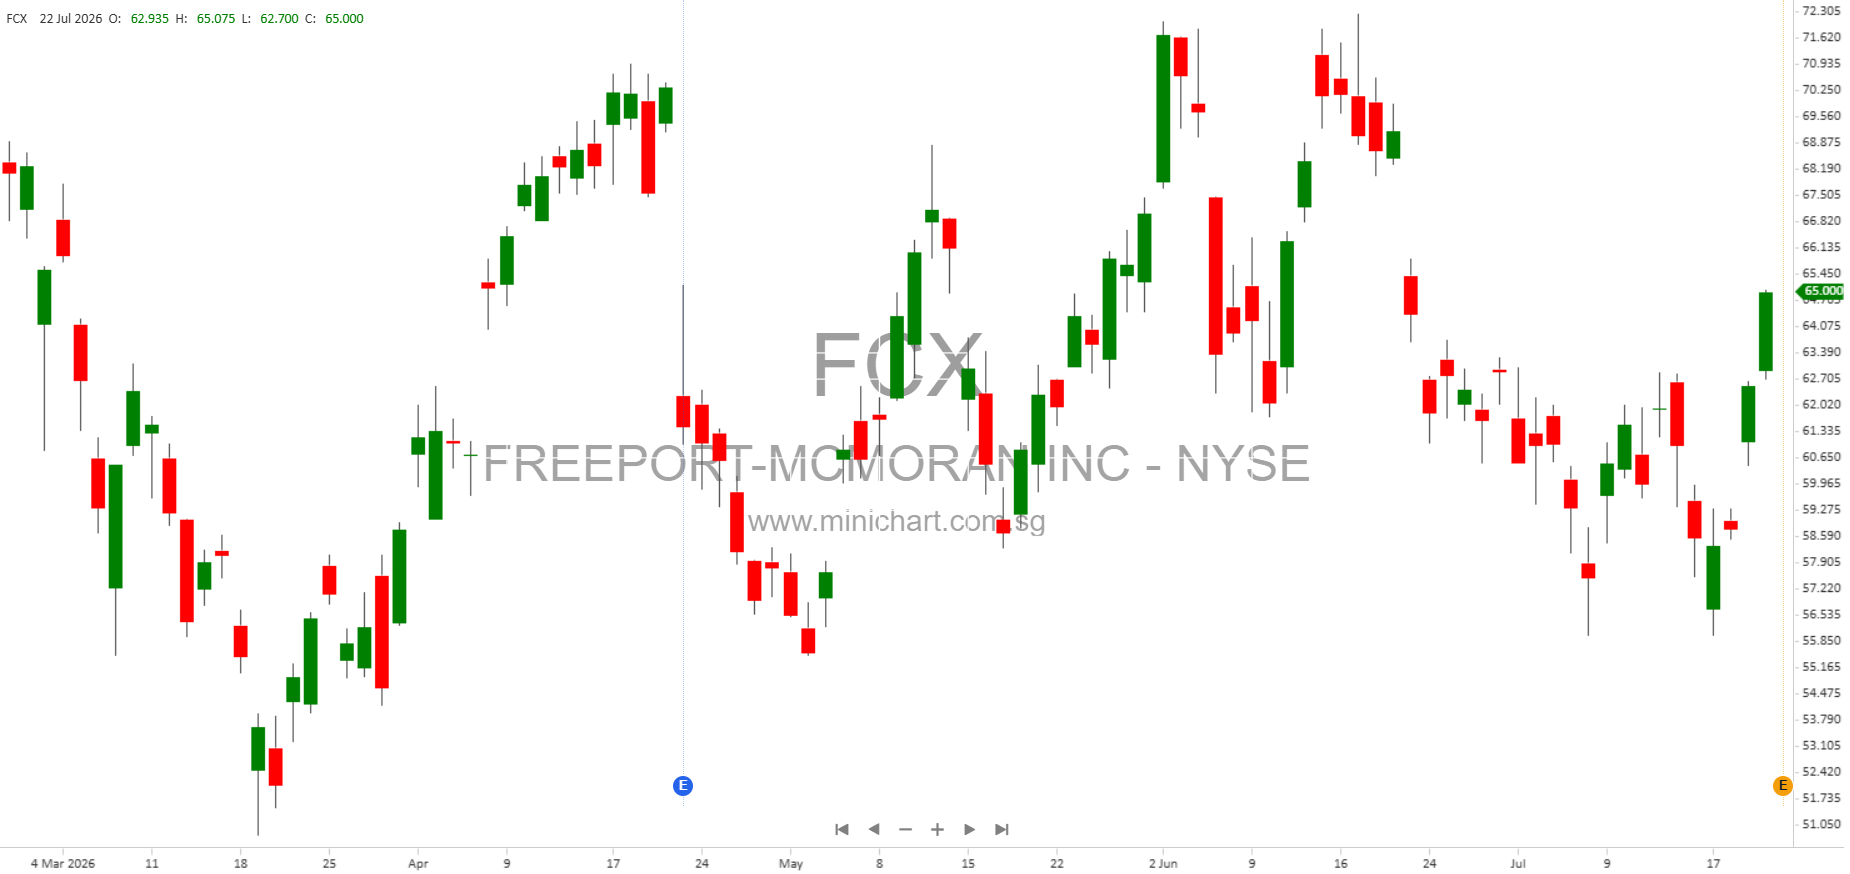
- Share buybacks: Q2 2026: 1.7 million shares repurchased (\$110 million, average \$64.34/share); first half: 3.4 million shares (\$203 million, average \$59.30/share).
- Dividends: \$0.15/share declared for Q2 (including \$0.075 base and \$0.075 variable, performance-based dividend); payable August 3, 2026.
- Cerro Verde stake increased: FCX purchased 2.0 million shares in Q2 for \$107 million, raising stake from 55.08% to 55.66%.
Operational Highlights and Strategic Growth
- Grasberg Block Cave ramp-up: Progressing on schedule. Focus on restoring full operations safely and sustainably after the September 2025 mud rush incident. Grasberg and other underground mines (DMLZ, Big Gossan) are among the lowest cost, largest copper/gold producers globally, with annual design capacity ~1.7 billion lbs copper, 1.3 million oz gold.
- Leaching & Technology Initiatives: U.S. and South America operations are incorporating new technologies and data analytics in leaching. Incremental copper production: 47 million lbs in Q2; 101 million lbs first half. Targeting annual run rate of 300 million lbs by year-end, with potential for further increases. Large-scale testing with new additive products at Morenci showing promising results.
- El Abra Expansion (Chile): Technical studies underway for a significant expansion project; completion expected in 2026. Decision will depend on study outcomes and market conditions.
- PTFI Kucing Liar deposit: Long-term mine development since 2022; ramp-up planned for 2030, targeting design capacity of 130,000 mt/day and average annual output of 750 million lbs copper.
- Exploration: Multiple targets identified for further leveraging infrastructure in Grasberg minerals district.
Cost and Margin Developments
- Copper unit net cash costs: Q2 2026: \$1.97/lb (including idle facility/restoration costs), favorable to estimates. Excluding special charges, costs remain competitive.
- Gold: Average realized price Q2 2026: \$4,520/oz (up from \$3,291/oz in Q2 2025).
- Molybdenum: Average realized price Q2 2026: \$28.75/lb (up from \$21.10/lb Q2 2025).
- Margins: Strong margins and positive cash flow outlook supported by favorable commodity prices.
Financial Policy and Capital Returns
- Performance-based payout framework: Up to 50% of available cash flows (post planned capex and distributions to noncontrolling interests) allocated to shareholder returns (dividends, buybacks); remainder for debt reduction and growth investments. Net debt target maintained at \$3-4 billion (excluding project debt for PTFI facilities).
- Share repurchase program: \$5 billion authorization; total repurchases to date: 55.4 million shares (\$2.2 billion, average \$39.80/share).
- Dividend payments: Both base and variable dividends subject to Board discretion, financial results, economic conditions, and net debt targets.
Price-Sensitive Issues for Shareholders
- PTFI Mud Rush Incident: Restoration costs continue to impact results (\$96 million after-tax Q2 2026), but insurance settlements offset some impacts (\$699 million gain in first half 2026). The safe ramp-up remains a critical operational focus and any delays or issues may affect production guidance and earnings.
- Commodity Price Exposure: Earnings and cash flow forecasts for 2026 are highly sensitive to copper, gold, and molybdenum prices. The company estimates each \$0.05 change in copper price affects revenues by \$9 million (\$3 million to net income).
- Expansion Decisions: Pending technical/economic studies at El Abra (Chile) may result in a major expansion, influencing future production and capital requirements.
- Leaching Innovations: Success in scaling up leaching technology could materially boost U.S. copper output and margins.
- Debt and Liquidity: Net debt remains below target, providing flexibility for shareholder returns and growth spending. Upcoming maturities in 2027 (\$0.7 billion PTFI, \$0.6 billion FCX senior notes) are noted, but liquidity is strong.
- Tax and Regulatory Risks: Effective 2026 tax rate guidance: 30% overall, with 40% for Peru, 36% Indonesia, 7% U.S. (CAMT provisions). Changes in laws, export duties, or Indonesia mining rights extensions may significantly affect operations and earnings.
- Forward-Looking Statements: Management cautions that actual results could differ materially due to commodity price fluctuations, operational challenges, regulatory changes, political/social risks (notably in Indonesia and Peru), and other external factors.
Supplemental Data
- Adjusted Net Income (Q2 2026): \$1.08 billion (\$0.74/share), after excluding \$96 million in net charges.
- Net Debt (June 30, 2026): \$2.07 billion (excluding \$3.24 billion PTFI project debt).
- Cash at June 30, 2026: \$4.08 billion; net cash available to parent: \$3.1 billion.
- Production Costs by Segment: Detailed cost and margin breakdowns provided for U.S., South America, Indonesia, and Molybdenum mines, including by-product and co-product methods.
- Derivative Instruments: Significant provisional pricing adjustments in copper sales; at June 30, 2026, 99 million pounds of copper sales are provisionally priced at \$6.07/lb.
- Shareholder Returns: Consistent dividend payments and ongoing share repurchases reflect management’s focus on capital returns.
Conclusion and Potential Share Price Impact
Freeport-McMoRan’s Q2 2026 report contains several positive developments likely to be price-sensitive:
- Better-than-expected copper sales and favorable unit cash costs.
- Strong progress and promising results in leaching technology and ramp-up of major mines.
- Robust cash flows and capital return policy, supported by a healthy balance sheet and below-target net debt.
- Pending expansion decisions at El Abra could materially impact future growth.
- Risks remain related to ongoing restoration at Grasberg, commodity price exposure, and regulatory/political uncertainties.
Investors should monitor upcoming developments in mine ramp-ups, technology adoption, expansion projects, commodity price trends, and potential changes in financial policy or returns to shareholders.
Disclaimer: The information in this article is based on Freeport-McMoRan’s official Q2 2026 earnings release and supplemental schedules. Forward-looking statements are subject to numerous risks and uncertainties, including commodity price fluctuations, operational challenges, regulatory changes, and geopolitical events. Actual results may differ materially. Investors are advised to review the company’s filings and consult their financial advisors before making investment decisions.