Dow Inc. Delivers Robust Q2 2026 Results, Raises Guidance on Self-Help Initiatives
Key Highlights from Q2 2026 Earnings Report
- Net Sales: \$12.1 billion, up 20% year-over-year, driven by price increases across all segments and geographies.
- Local Pricing: Up 20% year-over-year, especially strong in Packaging & Specialty Plastics due to higher polyethylene prices.
- Currency Impact: Added 1% to sales growth.
- Volume: Down 1% year-over-year, with declines in Packaging & Specialty Plastics offsetting gains in Performance Materials & Coatings due to planned maintenance.
- GAAP Net Income: \$802 million (compared to a \$801 million loss in prior year).
- Operating EBIT: \$1.6 billion, up \$1.7 billion year-over-year, driven by price and internal efficiency programs.
- GAAP EPS: \$0.99; Operating EPS: \$1.44 (adjusted for significant items), marking a sharp turnaround from a \$0.42 loss in Q2 2025.
- Operating Cash Flow: \$1.3 billion, up significantly versus last year, despite working capital build due to higher revenues.
- Shareholder Returns: \$253 million in dividends paid during the quarter.
CEO Commentary and Upward Guidance Revision
CEO Karen S. Carter emphasized disciplined execution, customer service, and the acceleration of self-help initiatives. She highlighted that market conditions were supportive and that internal improvements are ahead of plan. Dow now expects to generate approximately \$200 million more in benefits from the “Transform to Outperform” program this year, increasing total in-year benefits from self-help actions to more than \$1.3 billion, positioning Dow to deliver enhanced long-term shareholder value.
Segment Performance: Detailed Breakdown
Packaging & Specialty Plastics
- Net Sales: \$6.4 billion, up 27% YoY.
- Price Impact: Local prices up 30% YoY, particularly strong in polyethylene.
- Volume: Down 4% due to planned maintenance and lower sales in EMEAI and Asia Pacific, impacted by Middle East conflict.
- Operating EBIT: \$1.3 billion, up by \$1.2 billion YoY, due to higher polyethylene prices and internal margin expansion, though partly offset by maintenance downtime.
- Hydrocarbons & Energy: Higher olefins prices offsetting lower volume due to maintenance and a cracker restart in EMEAI.
Industrial Intermediates & Infrastructure
- Net Sales: \$3.2 billion, up 14% YoY.
- Price Impact: Local prices up 15% YoY.
- Volume: Down 2%, with lower volumes in Polyurethanes & Construction Chemicals, partly offset by growth in Industrial Solutions for data center demand.
- Operating EBIT: \$246 million, up \$431 million YoY, benefiting from higher margins, lower maintenance, and suspension of Sadara equity losses.
Performance Materials & Coatings
- Net Sales: \$2.4 billion, up 11% YoY.
- Local Price: Up 4% YoY.
- Volume: Up 6% YoY, led by growth in downstream silicones for consumer, electronics, and home care applications.
- Operating EBIT: \$133 million, down \$19 million YoY, as higher fixed costs and a shutdown in the Barry, UK plant offset internal improvement benefits.
Outlook: Strategic Priorities & Guidance
Looking to the second half of 2026, Dow will focus on:
- Growth and innovation in attractive end markets.
- Investing in and strengthening its portfolio.
- Balanced capital allocation.
Management expects the impact of “Transform to Outperform” to ramp up significantly through the rest of 2026 and into 2027, aiming to set a new industry standard in competitiveness and resilience.
Important Shareholder & Price-Sensitive Updates
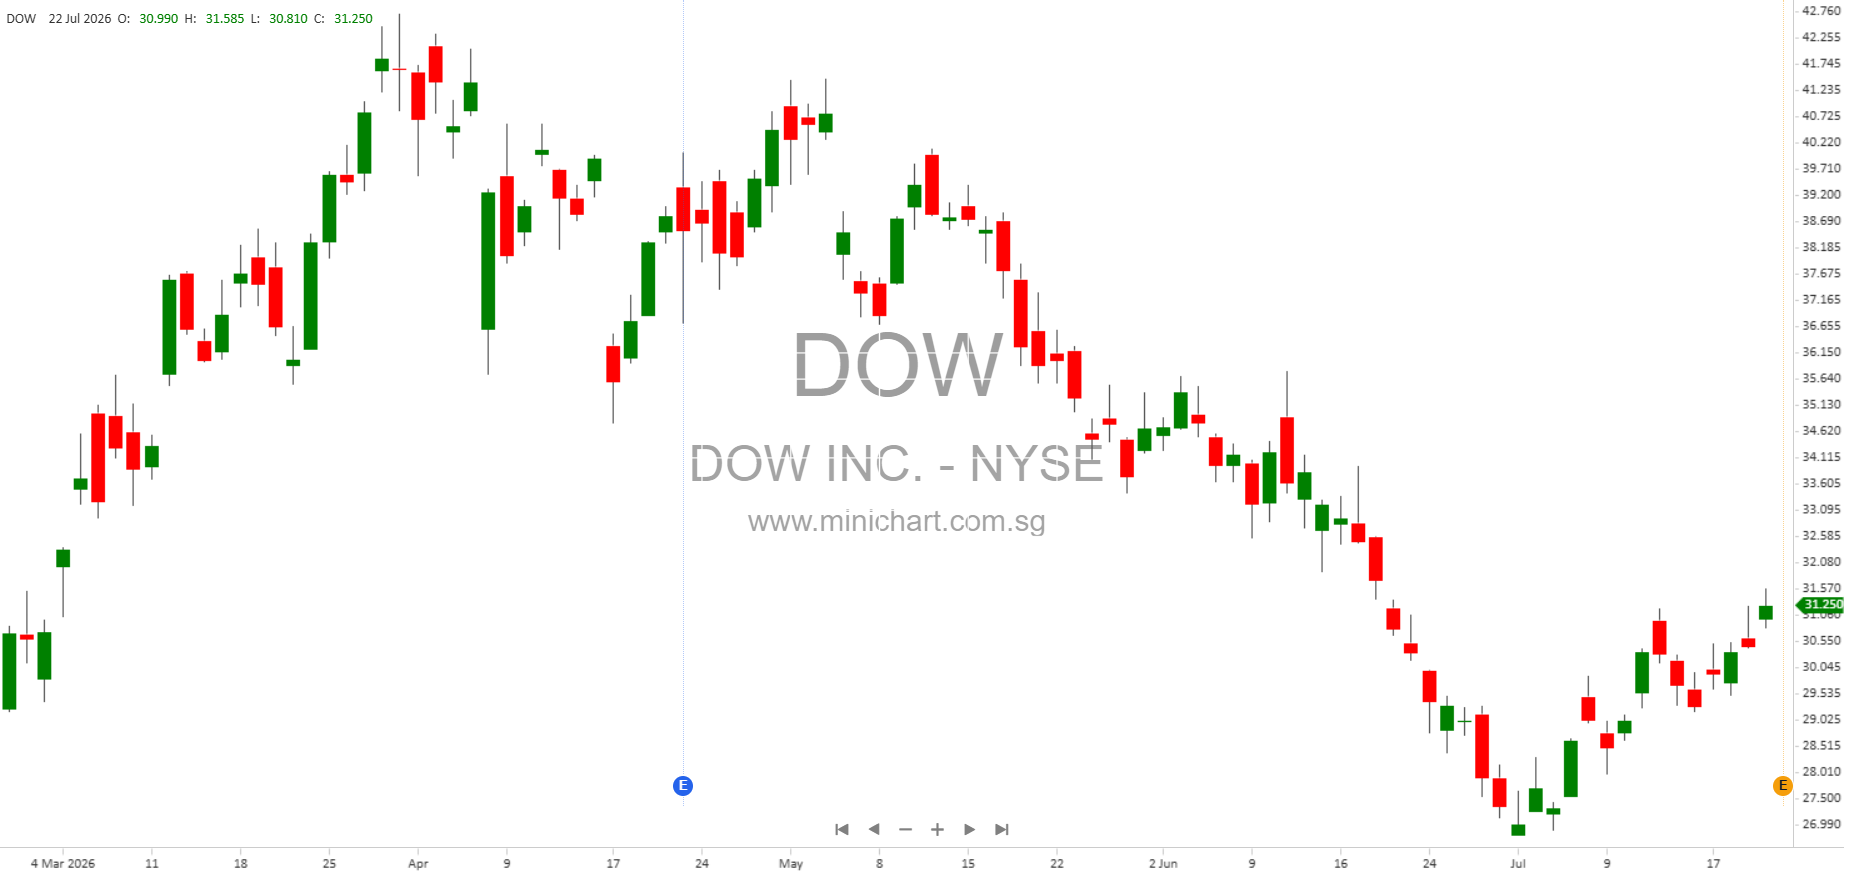
- Transform to Outperform: Expected \$200 million additional benefit in 2026, for a total of over \$1.3 billion in annualized self-help improvements. This sizable upward revision is likely to be seen as a positive catalyst for the share price.
- Significant Items: Q2 2026 operating EPS excludes \$0.45 per share of significant items, mainly costs associated with the restructuring program, partly offset by a tax benefit from a legal settlement with NOVA Chemicals.
- Balance Sheet Strengthening: Cash and cash equivalents stood at \$3.97 billion as of June 30, 2026, compared to \$3.82 billion at year-end 2025. Total assets rose to \$61.6 billion, with equity stable at \$17.4 billion.
- Restructuring Costs: Notable ongoing restructuring and asset-related charges continue to impact results, but are expected to deliver greater efficiencies and future margin expansion.
- Geopolitical & Market Risks: The company continues to face risks from Middle East conflicts, global economic conditions, and regulatory changes – all flagged as potentially material to future results.
- Legal Matters: Recent income tax adjustments stem from a payment related to a legal dispute with NOVA Chemicals and ongoing settlements related to historical environmental matters.
- Dividend Policy: Continued commitment to returning capital, with \$253 million paid in dividends this quarter alone.
Non-GAAP Measures and Adjustments
Dow emphasizes non-GAAP metrics like Operating EBIT, Operating EPS, Free Cash Flow, and Cash Flow Conversion as more representative of ongoing performance due to the impact of significant restructuring, legal, and tax items. For Q2 2026, Free Cash Flow was \$692 million versus a negative \$1.13 billion in Q2 2025, reflecting a sharp turnaround in operational performance.
Notably, the company does not provide forward-looking GAAP reconciliations due to the unpredictability of future significant items.
Risks & Forward-Looking Statements
Management flagged a wide range of risks that could impact future results, including but not limited to: supply chain disruptions, geopolitical conflicts (Russia/Ukraine, Middle East), commodity price volatility, regulatory changes, environmental liabilities, and the success of ongoing restructuring and self-help programs.
Investors should note that any unanticipated changes in these areas could materially affect Dow’s future earnings and share price.
Disclaimer: This article is for informational purposes only and is not investment advice. It is based on Dow Inc.’s Q2 2026 earnings report and incorporates management commentary and financial data. Investors are encouraged to read the company’s official filings and consult with their financial advisor before making investment decisions. Past performance is not indicative of future results.