CVB Financial Corp. Reports Strong Q2 2026 Results: Key Insights for Investors
Highlights of the Second Quarter of 2026
- Net Interest Income: Surged by \$44.6 million (37.8%) from Q1 2026, reaching \$162.4 million.
- Net Interest Margin: Improved to 3.72%, up 28 basis points from Q1 2026.
- Loan Growth: Loans increased by \$3.37 billion (39.0%) compared to the end of Q1 2026.
- Deposit Growth: Average total deposits and customer repurchase agreements grew by \$3.60 billion (29.0%) from Q1 2026.
- Noninterest-Bearing Deposits: 52.8% of total deposits were noninterest-bearing at quarter end.
- Cost of Funds: Decreased marginally to 0.96% from 0.97% in Q1 2026.
- Efficiency Ratio: Adjusted efficiency ratio (excluding acquisition expense and provision for unfunded loan commitments) stood at 43.88%.
- Share Repurchase Plan: Announced a new plan for up to 15 million shares, replacing the prior 2024 program.
- Key Transaction: Completed sale of SFR mortgage pool loans acquired from Heritage with a fair value of \$327 million.
Income Statement & Financial Metrics
- Net Earnings: \$48.3 million for Q2 2026, compared to \$51.0 million in Q1 2026 and \$50.6 million in Q2 2025.
- Earnings Per Share: Basic and diluted EPS both at \$0.29 for Q2 2026, compared to \$0.38 in Q1 2026 and \$0.37 in Q2 2025.
- Dividend: Cash dividends declared per common share remained steady at \$0.20.
- Return on Average Assets (ROAA): 0.97% for Q2 2026, down from 1.33% in Q1 2026.
- Return on Average Equity (ROAE): 6.41% for Q2 2026, down from 8.86% in Q1 2026.
- Return on Average Tangible Common Equity (ROATCE): 10.85% for Q2 2026.
- Book Value Per Share: \$17.98 as of Q2 2026.
- Tangible Book Value Per Share: \$11.07 as of Q2 2026.
- Dividend Payout Ratio: 73.25% in Q2 2026, significantly higher than 53.32% in Q1 2026.
Balance Sheet and Asset Quality
- Total Assets: \$21.18 billion at June 30, 2026, up from \$15.63 billion at December 31, 2025.
- Loans and Lease Finance Receivables: \$12.02 billion (up from \$8.70 billion YoY).
- Investment Securities: \$5.27 billion (30.01% of total interest-earning assets).
- Allowance for Credit Losses: Allowance to nonperforming assets ratio high at 751.77% (indicative of strong credit provisioning).
- Nonperforming Assets: Remained low at 0.08% of total assets.
Regulatory Capital Ratios
- Tier 1 Leverage Capital Ratio: 11.7% (well above regulatory minimum of 4.0%).
- Common Equity Tier 1 Capital Ratio: 14.7% (minimum required: 7.0%).
- Total Risk-Based Capital Ratio: 15.8% (minimum required: 10.5%).
Strategic and Price-Sensitive Developments
- Heritage Acquisition: Integration continues with completed sale of SFR mortgage pool loans. Management highlights merger-related synergies, cost savings, and expanded geographic coverage, but notes risks in integration and potential deposit attrition.
- Share Repurchase Program: Up to 15 million shares authorized for buyback, replacing previous plan. This could provide support for the share price and signals confidence in future performance.
- Efficiency Ratio: A substantial improvement in adjusted efficiency ratio (43.88%) signals effective cost management and could positively impact profitability and investor confidence.
- Loan and Deposit Growth: Significant increases in both loans and deposits, indicating robust business expansion and market share gains.
- Dividend Policy: The high dividend payout ratio may indicate a shift in capital allocation priorities or a response to changing earnings dynamics.
Guidance, Risks, and Forward-Looking Statements
- Management provides caution about risks including economic conditions, monetary policy, inflation, integration risks from the Heritage acquisition, credit quality, regulatory changes, and deposit retention.
- Forward-looking statements indicate optimism about continued growth, profitability, and capital strength, but acknowledge uncertainties and potential challenges ahead.
Investor Takeaways
- Strong Growth: CVB Financial Corp. is demonstrating robust loan and deposit growth, improved margins, and strong asset quality.
- Capital Strength: All regulatory capital ratios are well above minimums, supporting stability and future expansion.
- Strategic Actions: The new share repurchase plan and successful integration of Heritage are positive signals, though risks remain.
- Efficiency Gains: Improved operational efficiency could enhance long-term profitability.
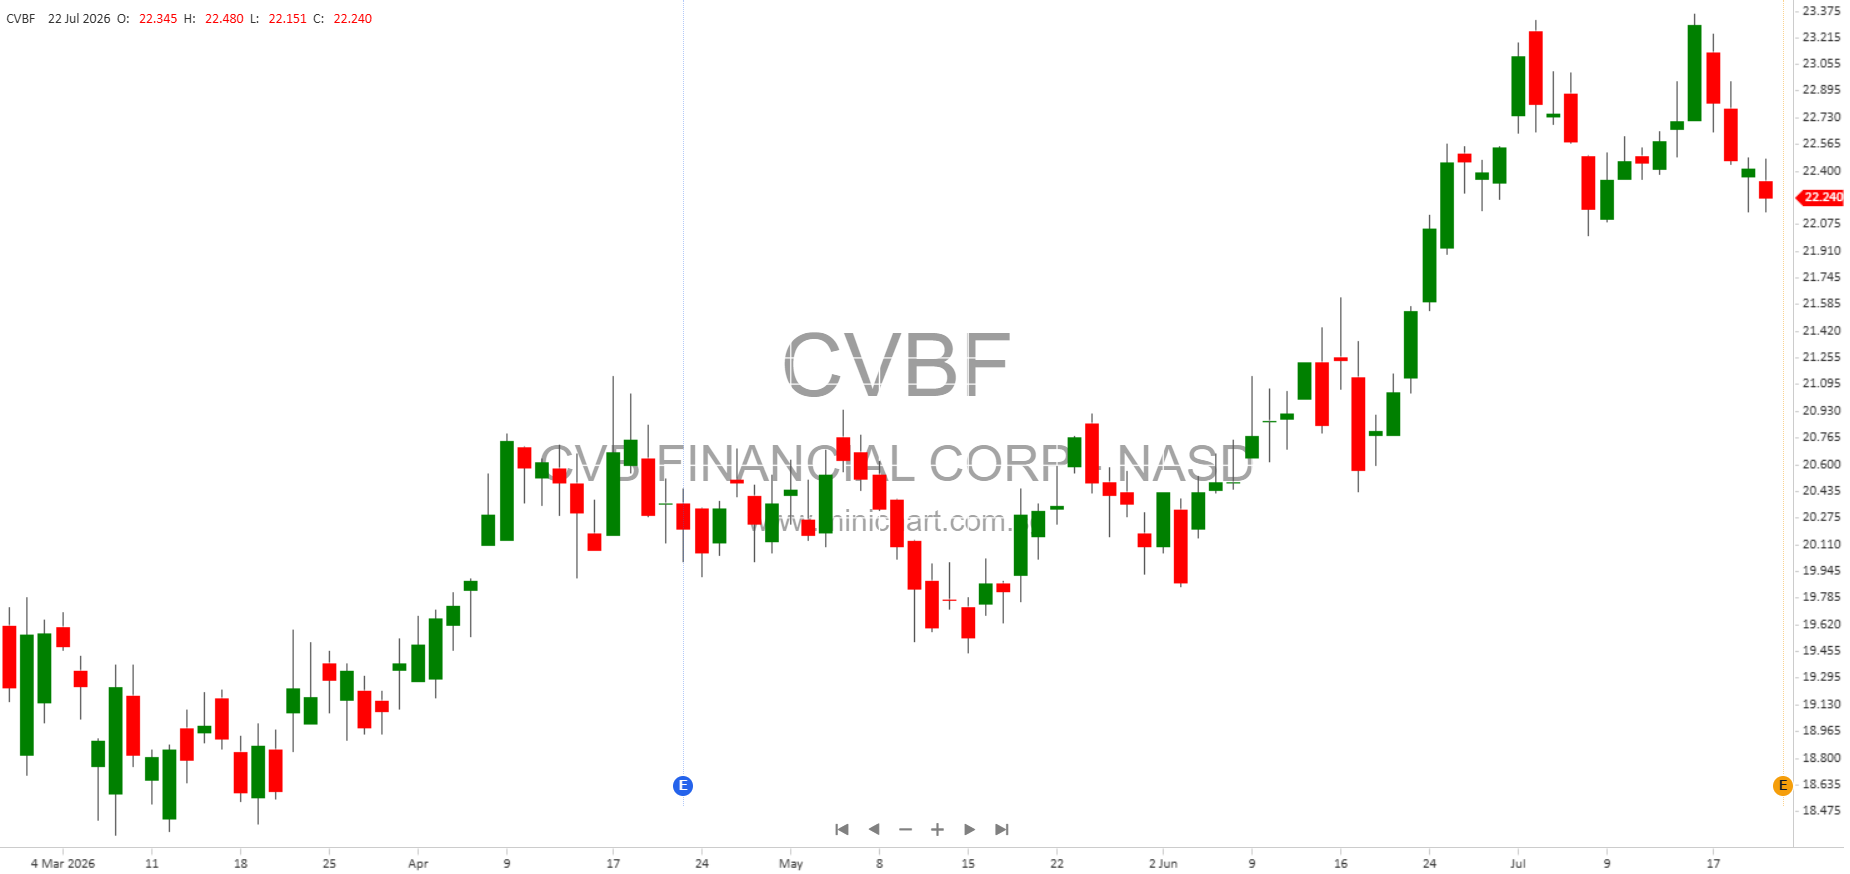
- Potential Price Sensitivity: The share buyback, dividend policy, and merger integration progress are all factors that could influence share price in the near term.
Disclaimer
This article is for informational purposes only and does not constitute investment advice. Forward-looking statements are subject to risks and uncertainties, and actual results may differ materially. Investors should consult official filings and conduct their own due diligence before making investment decisions.