Bankwell Financial Group Reports Strong Q2 2026 Results, Raises Guidance
Summary of Key Financial Results
- Q2 2026 GAAP Net Income: \$12.4 million, or \$1.52 per diluted share, up from \$11.3 million (\$1.41 per share) in Q1 2026.
- Return on Average Assets (ROAA): 1.46% for Q2 2026.
- Return on Average Tangible Common Equity (ROATCE): 15.61% for Q2 2026.
- Efficiency Ratio: Improved to a peer-leading 47.5% versus 55.8% in Q1 2026.
- Dividend: \$0.20 per share cash dividend declared, payable August 21, 2026 to shareholders of record on August 10, 2026.
- Net Interest Margin (NIM): Expanded by 30 basis points to 3.58%.
- Gross Loans: Grew by \$93.1 million (3.2%) in Q2, reaching \$3.0 billion.
- Core Deposits: Increased by \$128 million in Q2, including \$72 million growth in noninterest bearing and NOW deposits.
- Wholesale Funding Ratio: Reduced to 16.3%, down from 21.2% at year-end 2025.
- Allowance for Credit Losses (ACL) – Loans: \$30.6 million, 1.03% of total loans. ACL coverage of nonperforming loans increased to 193.1%.
- Regulatory Capital Ratios Remain Solid: Total risk-based capital ratio at 12.70%, CET1 at 11.66%, leverage ratio at 10.36%.
Upward Guidance Revision for Full-Year 2026
- Net Interest Income Guidance: Increased to \$115–\$117 million (from prior guidance).
- Loan Growth Outlook: Raised to 5%–7% for the year.
- Non-Interest Income: Reiterated at \$12–\$13 million, with strong SBA loan sale gains (\$2.4 million in Q2, \$4.8 million year-to-date, up from \$1.5 million in 1H 2025).
- Non-Interest Expense: Raised to \$65–\$67 million full-year, reflecting targeted investments in talent and infrastructure, but not expected to negatively impact the efficiency ratio.
Strategic and Operational Highlights
- Deposit Franchise Strength: Robust core deposit growth funded loan production and reduced reliance on more costly wholesale and brokered funding. Brokered deposits fell 50.6% from December 2022 peak.
- Loan Originations: \$268.2 million of funded originations in Q2, including \$26 million in SBA loans, outpaced portfolio run-off.
- Expense Management: Non-interest expense declined to \$15.3 million from \$16.9 million in Q1, mainly due to lower salaries and benefits after seasonal Q1 compensation costs.
- Pre-Provision Net Revenue (PPNR): Rose 31.4% to \$17.5 million, or 2.07% of average assets, driven by revenue growth and efficiency improvements.
- Credit Quality: Net loan recoveries (minimal charge-offs), nonperforming assets fell to \$15.9 million (0.46% of assets), and past due loans remain low (0.59% of total loans). ACL coverage of nonperforming loans is robust at 193%.
Balance Sheet and Capital Strength
- Total Assets: \$3.48 billion at June 30, 2026, up 3.4% from year-end 2025.
- Total Loans: \$3.0 billion, up 4.2% year-to-date and 10.9% year-on-year. Growth was led by commercial real estate and commercial business loans.
- Total Deposits: \$3.0 billion, up 6.0% year-to-date and 8.7% year-on-year. Notably, noninterest bearing deposits grew 16.9% YTD.
- Shareholders’ Equity: \$323.5 million, up \$22 million from year-end due to strong net income, partially offset by \$3.2 million in dividends paid.
- Tangible Book Value Per Share: \$40.25, up from \$38.79 in Q1 2026.
Management Commentary and Outlook
CEO Christopher R. Gruseke highlighted record profitability and efficiency, and emphasized that investments in talent and infrastructure are planned to support continued growth. The company’s peer-leading efficiency ratio and strong operating leverage are important for shareholders, as they suggest Bankwell is well positioned for continued earnings growth and capital return.
Potentially Price-Sensitive Information for Investors
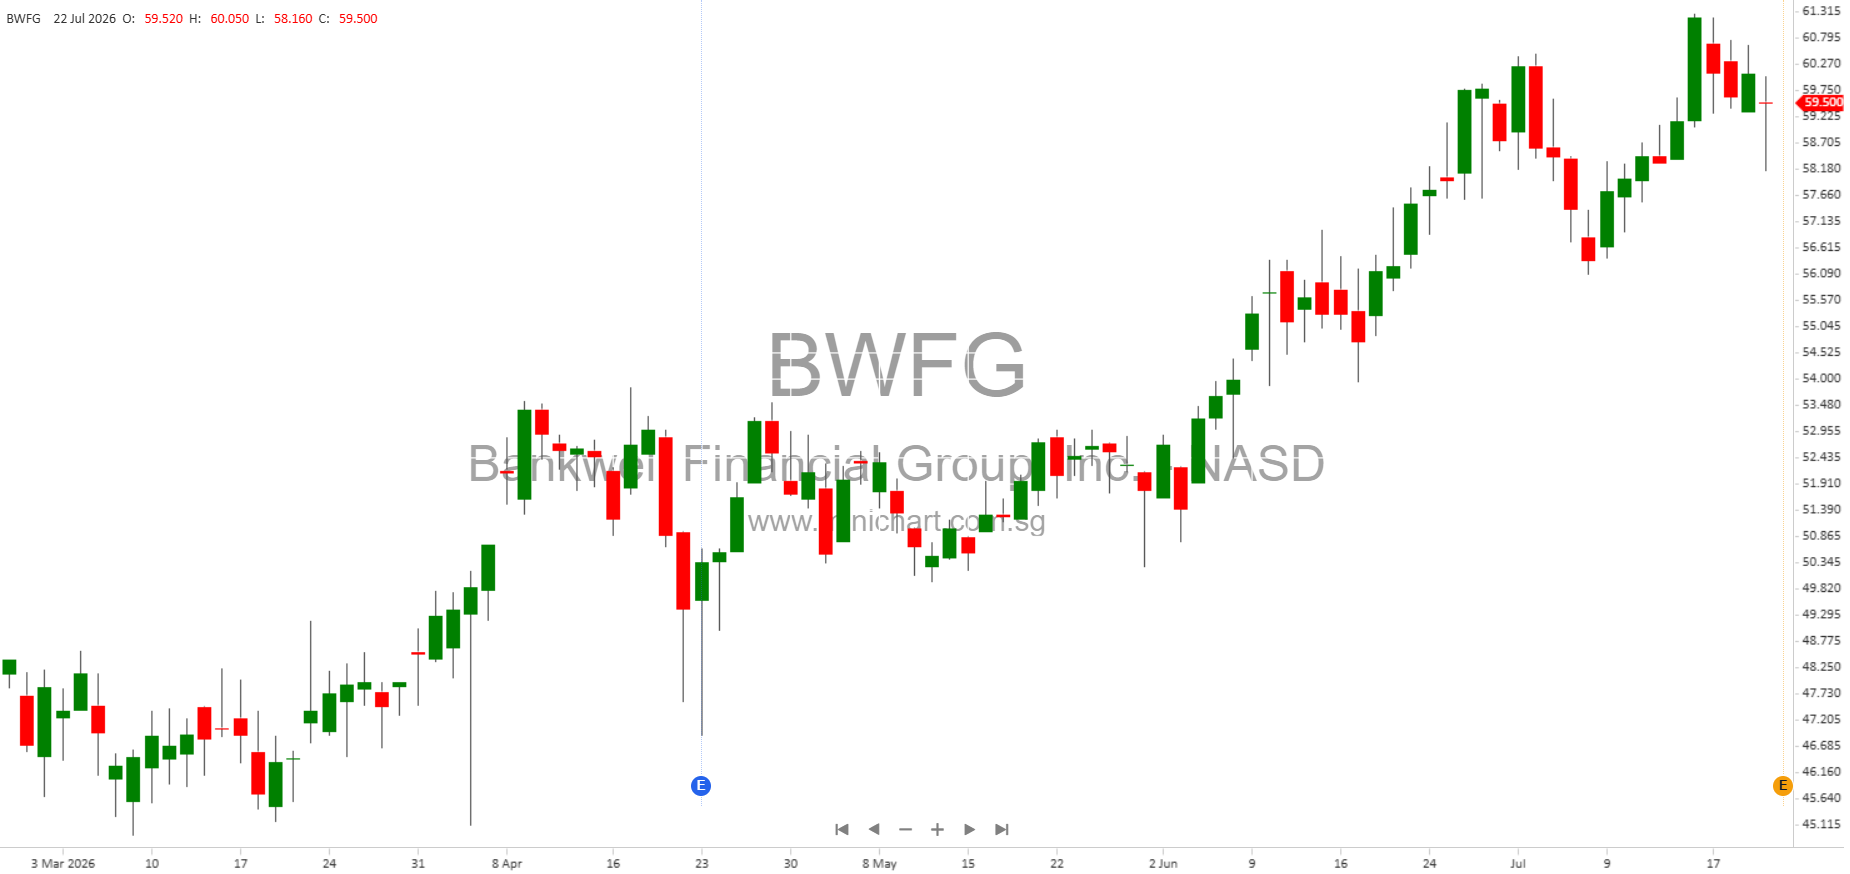
- Raised Guidance: The upward revisions to net interest income and loan growth guidance are positive surprises and may support further share price appreciation.
- Efficiency Ratio Improvement: Achieving a 47.5% ratio, among the best in the peer group, signals strong expense control and earnings leverage.
- Robust Capital and Asset Quality: High capital ratios and coverage of nonperforming loans provide downside protection and may enable more aggressive capital return in the future.
- Dividend Sustainability: Low payout ratio (13.16% in Q2) suggests there is room for potential future dividend increases.
- Deposit and Loan Growth: Outpacing peers in core deposit and loan growth, especially in a competitive environment, may drive further market share gains and earnings upside.
Conference Call Details
Bankwell will host a conference call to discuss the results and business outlook on July 23, 2026, at 11:00 a.m. ET. The call and supplemental slides are available at https://investor.mybankwell.com/events-and-presentations/.
About Bankwell Financial Group
Bankwell Financial Group, Inc. is the holding company for Bankwell Bank, a full-service commercial bank headquartered in New Canaan, CT, focused on providing financing, SBA loans, mortgages, and deposit services to businesses and professionals.
Disclaimer: This article is for informational purposes only and does not constitute investment advice. Forward-looking statements are subject to risks and uncertainties, including but not limited to interest rate changes, economic conditions, competitive pressures, and regulatory changes. Investors should consult official filings and their financial advisors before making investment decisions regarding Bankwell Financial Group, Inc.