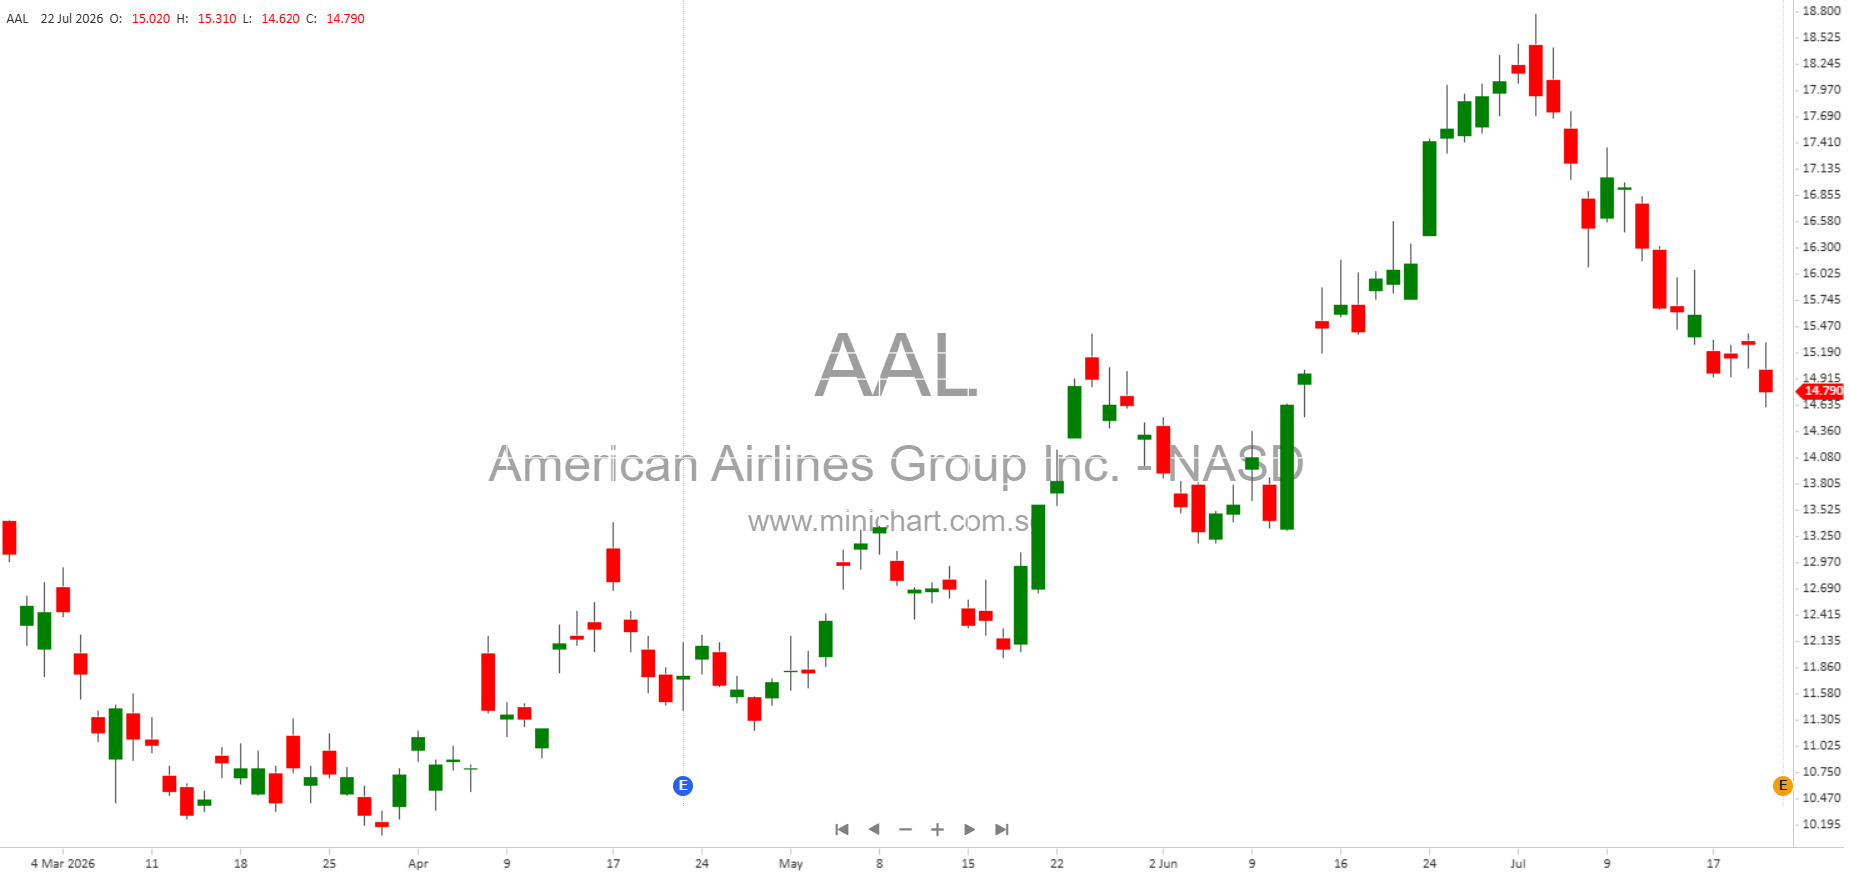
American Airlines Group Inc. (NASDAQ: AAL) Reports Record Second-Quarter 2026 Results
Key Highlights for Investors
- Record Revenue: American Airlines reported its highest quarterly revenue in company history, totaling \$16.7 billion in Q2 2026, up 16.3% year-over-year.
- Profitability: GAAP net income was \$71 million (\$0.11 per diluted share), with adjusted net income at \$99 million (\$0.15 per diluted share).
- Strong Demand & Commercial Execution: Robust customer demand and successful execution of commercial priorities offset nearly 50% of a massive year-over-year fuel expense increase of over \$2.2 billion (up 83%).
- Premium Revenue Growth: Passenger unit revenue for premium cabins surged by 13.4%, Main Cabin revenue grew 8.8%, and domestic passenger unit revenue rebounded by 10.6%.
- International Strength: Atlantic unit revenue up 8.9%, Pacific up 15.1%, and Latin America up 6.6%.
- Corporate Travel Recovery: Managed corporate revenue increased 26% year-over-year, marking the fifth consecutive quarter of double-digit growth.
- Customer Experience Investments: Net Promoter Score (NPS) improved by 5 points year-over-year. Plans to install Starlink high-speed Wi-Fi beginning in 2027 were announced, enhancing onboard connectivity.
- Loyalty Program Momentum: AAdvantage® enrollments grew by more than 30% year-over-year, with second-quarter card spend (co-branded with Citi) up 8%.
- Operational Efficiency: Capacity grew 5.4% year-over-year. On-time arrival performance improved 2.8 points. CASM-ex (cost per available seat mile excluding special items, fuel, and profit sharing) rose about 3% year-over-year.
- Liquidity & Balance Sheet: Ended Q2 with \$11.3 billion in total available liquidity; completed several financings to bolster liquidity and address its only meaningful maturity in 2027. Continues to focus on debt reduction and achieving leverage targets.
- Financial Guidance: For Q3 2026, expects revenue growth of 16%–19% year-over-year, with CASM-ex up 2.5%–4.5% and average fuel price at \$3.75/gallon. Full-year 2026 adjusted earnings (loss) per share guidance is a wide range: (\$0.65) to \$0.65 per diluted share, reflecting ongoing fuel price volatility.
Detailed Financial & Operational Results
Revenue & Expense Breakdown
- Passenger Revenue: \$15.2 billion, up 13% YoY.
- Cargo Revenue: \$273 million, up 29.7% YoY.
- Other Revenue: \$1.25 billion, up 17.9% YoY.
- Total Operating Revenue: \$16.74 billion.
- Aircraft Fuel & Related Taxes: \$4.88 billion (up 83.3% YoY).
- Salaries, Wages & Benefits: \$4.64 billion (up 5.9% YoY).
- Total Operating Expenses: \$16.29 billion (up 22.9% YoY).
- Operating Income: \$446 million (down 60.7% from \$1.135 billion in Q2 2025).
- Net Income: \$71 million (down from \$599 million in Q2 2025).
- Adjusted Net Income: \$99 million.
- Operating Margin: 2.7% (down from 7.9% in Q2 2025).
- Pre-tax Margin: 0.6% (down from 5.8% in Q2 2025).
- Passenger Load Factor: 83.2% (down 1.5 points YoY).
- Yield: 22.33 cents (up 11.9% YoY).
- Revenue Passenger Miles: 68.1 billion.
- Available Seat Miles: 81.8 billion.
- Aircraft at End of Period: 1,609 (up 4.5% YoY).
- Full-time Equivalent Employees: 143,400 (up 3.8% YoY).
Regional Performance
- Domestic Revenue: \$10.73 billion (up 17.1% YoY), with yield up 13.1%.
- Latin America Revenue: \$1.73 billion (up 11.4% YoY), yield up 8.1%.
- Atlantic Revenue: \$2.35 billion (up 12.8% YoY), yield up 8.9%.
- Pacific Revenue: \$409 million (up 24.6% YoY), yield up 17.3%.
- Total International Revenue: \$4.49 billion (up 13.2% YoY), yield up 9.2%.
Strategic & Operational Initiatives
- Network Expansion: Added new nonstop European routes (Budapest, Prague, Athens), and resumed service to Caracas, Venezuela.
- Hub Investments: Improved hub connectivity and reduced system misconnections by 25% YoY at DFW, resulting in unit revenue growth 4 points above system average.
- Premium Product Growth: Adding premium seats through new aircraft (Boeing 787-9, Airbus A321XLR) and retrofits. Will offer more premium seats than any other airline this summer.
- Upsell Initiatives: 5-point increase in upsell rate from Basic Economy to Main Cabin due to updated fee structure and offerings.
- Efficiency Investments: Continued efforts in procurement, technology, and process reengineering reflected in improved efficiency metrics.
- Liquidity Actions: Completed financings, addressed 2027 debt maturity, and ended quarter with \$11.3 billion in available liquidity.
Shareholder-Relevant and Price-Sensitive Information
- Fuel Expense Surge: The company faced a massive fuel expense increase (+\$2.2 billion, +83% YoY) in Q2 and expects Q3 fuel expense to be up \$1.7 billion YoY. This volatility directly impacts earnings guidance and share price risk.
- Earnings Guidance: Full-year 2026 adjusted EPS guidance is (\$0.65) to \$0.65, a wide range indicating high uncertainty, primarily due to fuel price volatility.
- Liquidity Position: American Airlines has \$11.3 billion in liquidity, and recent financings addressed its only meaningful debt maturity in 2027—a positive for financial stability.
- Debt & Leverage Focus: The company is committed to reducing debt and lowering interest expense, which may affect future profitability and risk profile.
- Premium Revenue & Corporate Travel Recovery: Double-digit growth in premium and managed corporate revenue signals a potential shift in demand dynamics, which could positively impact future earnings and share value.
- Loyalty Program Expansion: AAdvantage® enrollments up 30% YoY and co-branded card spend up 8% are key drivers for recurring revenue and margin improvement.
- Operational Efficiency: CASM-ex up 3% YoY, but continued investments in efficiency may drive margin expansion over time.
- Risk Factors: The report highlights numerous risks to future results, including economic downturns, fuel price volatility, competitive pressures, labor disputes, cybersecurity risks, environmental regulations, and supply chain dependencies.
Forward-Looking Statements & Risks
The company cautions investors that its forward-looking statements are subject to significant uncertainty, especially regarding fuel prices, economic conditions, debt levels, competitive dynamics, and operational risks. Actual results may differ materially from guidance due to these factors.
Conclusion
American Airlines’ record revenue, robust demand recovery, and strategic investments suggest continued momentum. However, fuel price volatility, operational risks, and a wide earnings guidance range introduce significant uncertainty. Shareholders should closely monitor developments in fuel costs, debt reduction, premium revenue growth, and the loyalty program, as these factors are likely to influence future share values.
Disclaimer: This article is for informational purposes only and does not constitute investment advice. Investors should review official filings and consult their financial advisors before making any investment decisions. The information presented is based on company-released data and may be subject to change.