Northern Trust Q2 2026 Earnings: Robust Growth, Capital Actions, and Key One-Offs
Stellar Second Quarter Results Surpass Expectations
Northern Trust Corporation has delivered a standout second quarter for 2026, reporting net income of \$792.2 million, a remarkable increase of 51% from the prior quarter and 88% from Q2 2025. Earnings per diluted common share rose to \$4.23, up 56% quarter-over-quarter and 98% year-over-year. This is a substantial beat, driven by strong operating performance, capital markets activity, and several notable items.
Key Financial Highlights
- Total revenue reached \$2.71 billion, up 22% sequentially and 35% year-over-year.
- Return on average common equity surged to 25.9%, compared to 17.4% in Q1 2026 and 14.2% in Q2 2025.
- Operating leverage exceeded 700 basis points for the second consecutive quarter.
- Dividend increase: The Board approved a 10% increase to the quarterly dividend, raising it by \$0.08 to \$0.88 per share.
- Over \$1 billion capital returned to shareholders in H1 2026 through dividends and share repurchases.
Notable One-Off Items Impacting Results
The quarter included several significant, potentially price-sensitive items:
-
Visa, Inc. Exchange Offer Gain:
Northern Trust recognized a \$525.4 million pre-tax gain (\$396.4 million after-tax) from its participation in the second Visa, Inc. exchange offer. This materially boosted noninterest income and EPS. -
Portfolio Repositioning Loss:
There was a \$73.9 million pre-tax loss (\$54.4 million after-tax) on the sale of available-for-sale debt securities as the company repositioned its investment portfolio. -
Expense Charges:
- \$61.5 million pre-tax charge related to software dispositions (\$46.4 million after-tax).
- \$51.0 million in severance-related charges (\$38.5 million after-tax).
- \$33.1 million expense (pre-tax) for a broad-based one-time equity grant to employees (\$25.0 million after-tax).
Strong Underlying Performance (Excluding Notable Items)
- Earnings per share grew 40% (excluding notable items).
- Revenue growth was robust, supported by a 13% year-over-year increase in trust, investment, and other servicing fees, and double-digit net interest income growth.
- Organic trust-fee growth marked its eighth consecutive positive quarter.
- Expenses were well-controlled, despite the notable one-off charges.
Client and Segment Metrics
- Assets under custody/administration (AUC/A): Surpassed \$20 trillion for the first time, up 11% YoY.
- Assets under management (AUM): Hit \$2.0 trillion, up 16% YoY.
- Growth was primarily driven by favorable capital markets and net client inflows, partially offset by currency translation headwinds.
- Trust, investment, and other servicing fees rose 10% YoY to \$1.35 billion.
- Net interest income (FTE basis): \$683 million, up 11% YoY, with net interest margin rising to 1.81% (from 1.69%).
- Provision for credit losses: Negative \$5.3 million, reflecting improving credit quality and macroeconomic outlook.
- Noninterest expense increased 16% YoY (to \$1.64 billion), primarily due to the one-off charges.
Segment Results & Operating Leverage
- Asset Servicing: Income before taxes of \$323 million; pre-tax margin 23.7% (down due to one-off charges).
- Wealth Management: Income before taxes of \$333 million; pre-tax margin 37.4%.
- Other: Major swing to \$415.5 million profit, reflecting the Visa gain.
- Total pre-tax margin (FTE): 39.6%.
Balance Sheet and Capital Strength
- Common Equity Tier 1 (CET1) Capital Ratio: 12.2% (Standardized), well above regulatory minimums.
- Tier 1 Capital Ratio: 13.0%.
- Total Capital Ratio: 15.5%.
- Book value per share: \$68.41, up from \$65.40 in Q1 2026.
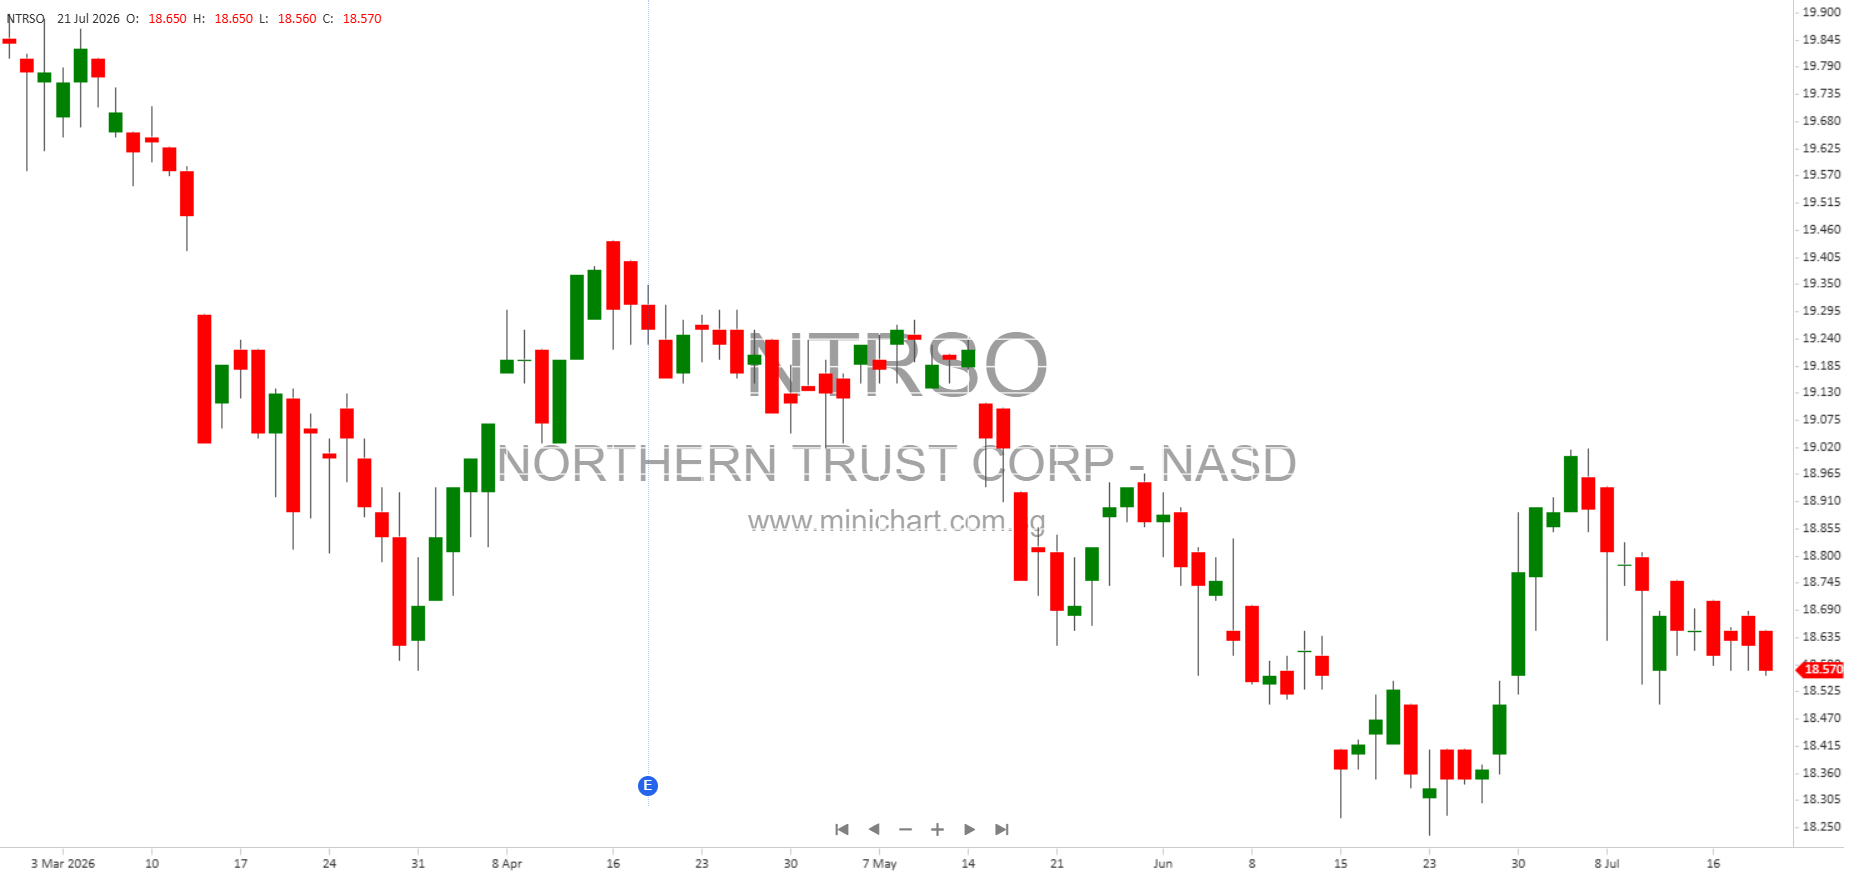
- Market value per share: \$173.84, up from \$139.57 in Q1 2026.
- Shares outstanding: 182.96 million at quarter-end, reflecting ongoing buybacks.
Capital Actions: Dividends and Share Repurchases
- Dividends: Declared \$148.8 million in common dividends, raising the quarterly rate by 10% to \$0.88 per share.
- Share Repurchases: Repurchased 2.13 million shares for a total of \$350.6 million at an average price of \$164.65 per share.
- Total capital returned to common shareholders in Q2: \$499.4 million.
Risks and Forward Outlook
Management remains focused on disciplined execution, advancing strategic priorities, and delivering sustainable performance. The outlook continues to benefit from strong capital markets and fee growth, but management acknowledges ongoing macroeconomic uncertainty, credit risk monitoring, and the impact of currency translation.
The effective tax rate rose slightly to 25.6%, due to lower tax benefits from share-based compensation, partly offset by discrete state tax benefits.
What Investors Need to Watch
- The one-off Visa gain is a significant, positive, non-recurring contributor to Q2’s results. Investors should adjust future expectations accordingly.
- The increase in dividend and robust buybacks signal strong capital and management confidence—typically positive for the share price.
- Expense management and organic trust-fee growth remain key drivers of sustainable performance.
- Credit quality appears strong, with a negative provision for loan losses and improvement in nonaccrual loans.
- Market and FX headwinds remain a risk factor, but the underlying business momentum appears strong.
Summary Table: Key Q2 2026 Metrics
| Metric | Q2 2026 | Q1 2026 | Q2 2025 | YoY Change |
|---|---|---|---|---|
| Net Income (\$M) | 792.2 | 525.5 | 421.3 | +88% |
| Diluted EPS (\$) | 4.23 | 2.71 | 2.13 | +98% |
| Total Revenue (\$M) | 2,705.6 | 2,213.2 | 2,002.6 | +35% |
| Trust/Investment/Other Servicing Fees (\$M) | 1,349.5 | 1,341.4 | 1,231.1 | +10% |
| Assets Under Custody/Admin (\$T) | 20.0 | 18.6 | 18.1 | +11% |
| Assets Under Management (\$T) | 2.0 | 1.78 | 1.70 | +16% |
| Return on Avg Common Equity (%) | 25.9 | 17.4 | 14.2 | +11.7pp |
| Dividend per Common Share (\$) | 0.88 | 0.80 | 0.75 | +17% |
Conclusion
Northern Trust’s Q2 2026 results show a bank firing on all cylinders: earnings and returns surged, capital returned to shareholders increased, and the company’s balance sheet and capital ratios remain robust. The large Visa gain is a one-off, but even on an adjusted basis, core business momentum is strong. The dividend hike and continued buybacks send a positive signal. Investors should note the significant one-off items, but the underlying growth in fees, revenue, and assets under custody/management is a bullish sign for the longer-term outlook.
Disclaimer: This article is for informational purposes only and does not constitute investment advice. Investors should conduct their own research and consult with a qualified financial advisor before making investment decisions. The author assumes no responsibility for investment actions taken based on this article.