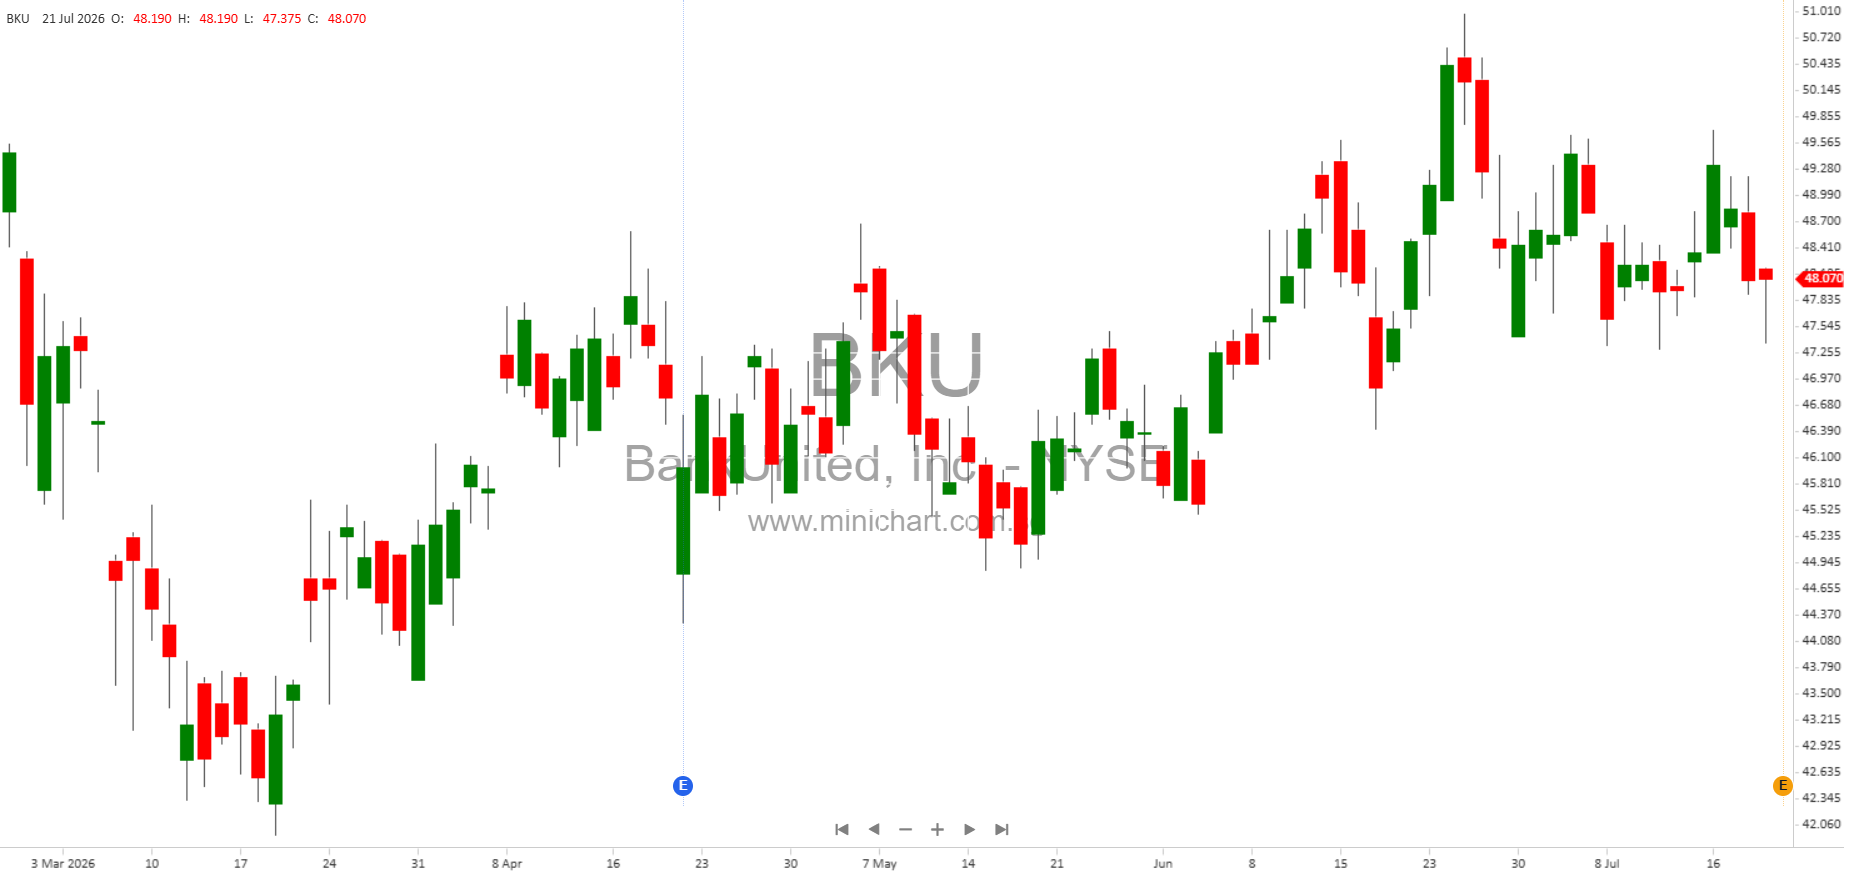
BankUnited, Inc. Reports Q2 2026 Earnings: Record Deposits, Improved Credit Quality, and Share Buybacks Highlight Solid Quarter
Key Financial Results and Business Highlights
- Net Income: \$70.7 million for Q2 2026, up from \$61.9 million in Q1 2026 and \$68.8 million in Q2 2025.
- Diluted Earnings Per Share (EPS): \$0.97, compared to \$0.83 in Q1 2026 and \$0.91 a year ago.
- Pre-Provision Net Revenue (PPNR): \$109.9 million, a slight increase from \$106.3 million last quarter and \$109.6 million a year ago.
- Return on Assets (ROA): 0.81% (up from 0.72% in Q1 2026).
- Return on Equity (ROE): 9.3% (up from 8.1% last quarter).
- Net Interest Margin: 3.06% (increasing from 2.99% in Q1 2026 and 2.93% in Q2 2025).
Record Non-Interest-Bearing Deposits and Strategic Funding Shift
- Average Total Deposits (excluding brokered): Up by \$811 million from Q1 2026 and \$1.5 billion from Q2 2025.
- Non-Interest Demand Deposits (NIDDA):
- Ending balance up \$991 million (11%) from Q1 2026 and \$822 million (9%) from a year ago.
- Average NIDDA up \$564 million (7%) from Q1 2026 and \$1 billion (13%) from a year ago.
- NIDDA now represents 34.4% of total deposits, up from 31.8% last year – the highest in the company’s history.
- Wholesale Funding: Declined by \$1.4 billion both quarter-over-quarter and year-over-year as part of continued balance sheet repositioning.
- Brokered Deposits: Now 10.5% of total deposits.
Loan Portfolio Developments
- Average Core Loans: Increased by \$195 million (1%) from the previous quarter and \$643 million (4%) year-over-year.
- CRE Loans: Up \$147 million (2%) from Q1 2026 and \$630 million (10%) from Q2 2025.
- Mortgage Warehouse Lending (MWL): Up \$82 million (13%) from last quarter, \$115 million (19%) year-over-year.
- Residential Loans: Down \$174 million (3%) from Q1 2026, down \$627 million (8%) year-over-year—consistent with the bank’s balance sheet repositioning strategy.
- Total Average Loans: Essentially flat, due to planned runoff in non-core loans.
Credit Quality Improvement and Reserves
- Non-Performing Loans (NPLs): Down \$51 million (19%) quarter-over-quarter and \$152 million (40%) year-over-year.
- Allowance for Credit Losses (ACL) to NPLs Coverage Ratio: Rose sharply to 97.14% (from 75.90% in Q1 2026 and 59.18% a year ago) as a result of lower NPL balances.
- Criticized and Classified Loans: Slightly increased by \$7 million (1%) from Q1 2026, but down \$170 million (14%) from last year.
- Net Charge-Offs: Annualized rate of 0.11%, down from 0.61% last quarter and 0.21% a year ago.
- Non-Performing Assets (NPA) Ratio: Improved to 0.66% of total assets (down from 0.79% last quarter and 1.08% a year ago).
Capital Strength and Shareholder Returns
- Common Equity Tier 1 (CET1) Ratio: 12.3%, up 10 basis points from both Q1 2026 and a year ago.
- Tangible Common Equity Ratio: 8.4%, up 10 basis points from Q1 2026, and up 30 basis points year-over-year.
- Tangible Book Value Per Share: \$40.48, a 6% increase from Q2 2025.
- Share Repurchases: Approximately 1.1 million shares repurchased in Q2 for \$50.1 million, demonstrating active capital return to shareholders.
- Accumulated Other Comprehensive Income (AOCI): Declined by \$13.9 million from Q1 2026 due to increased unrealized losses on available-for-sale securities; however, AOCI improved by \$14.3 million year-over-year.
Non-Interest Income and Expense Trends
- Non-Interest Income: \$29.2 million, up from \$24.7 million in Q1 2026 and \$27.8 million in Q2 2025—driven by higher capital markets revenue and increased deposit service charges/fees.
- Non-Interest Expense: \$174.6 million, up from \$167.4 million last quarter and \$164.3 million a year ago, reflecting higher deposit-related costs, a \$1.1 million loss from a real estate asset sale, elevated operational losses (\$1.3 million), and increased employee compensation/benefits.
- Notable Items: No major compensation-related or FDIC special assessment items this quarter, compared to prior periods.
Balance Sheet Snapshot (as of June 30, 2026)
- Total Assets: \$34.9 billion
- Total Deposits: \$28.9 billion
- Loans, net of allowance: \$23.7 billion
- Total Stockholders’ Equity: \$3.0 billion
Management Commentary
“Our second quarter performance reflects continued progress in strengthening the franchise and enhancing the quality of our balance sheet. Record non-interest-bearing deposits, solid fee income performance, and improved credit quality highlight the meaningful progress we have made over the past year. We remain focused on disciplined execution, deepening customer relationships, and building a stronger, more resilient franchise that supports long-term shareholder value creation.” — Rajinder Singh, Chairman, President and CEO
Shareholder-Relevant and Price-Sensitive Highlights
- Record levels of non-interest-bearing deposits and the highest NIDDA as a percentage of deposits in the company’s history signal strong franchise value and improved funding mix, which are typically viewed positively by investors.
- Significant reduction in non-performing loans and improved allowance coverage reduce risk and potential future credit costs, strengthening the investment case.
- Share repurchases of \$50.1 million in Q2 2026 demonstrate confidence in the bank’s valuation and commitment to returning capital to shareholders.
- Capital ratios remain robust, providing flexibility for further growth and capital return initiatives.
- Improved net interest margin amid a competitive rate environment indicates effective balance sheet management.
- Ongoing expense control and improved fee income performance support earnings quality.
- Active balance sheet repositioning—including runoff of non-core loans and reduction in wholesale funding—points to a more resilient, lower-risk profile going forward.
Upcoming Events
The company will host an earnings call to discuss these results on July 22, 2026, at 9:00 a.m. ET.
Conclusion
BankUnited, Inc. delivered a solid second quarter, marked by record core deposit growth, improved credit quality, and robust capital returns through share buybacks. The improvement in non-interest-bearing deposits, enhanced credit metrics, and disciplined capital management are likely to be positively received by the market and could be supportive for the company’s share price. Investors should monitor the continued execution of the bank’s strategic repositioning and any shifts in deposit/credit trends as the year progresses.
Disclaimer: This article is for informational purposes only and does not constitute investment advice. All financial data is sourced from BankUnited, Inc.’s official Q2 2026 earnings release and accompanying materials. Investors should conduct their own due diligence and consult with a qualified financial advisor before making investment decisions. The author and publisher are not liable for any losses incurred from investment actions based on this article.