Dave & Buster’s Entertainment, Inc. Q1 2026 Financial Report: Key Insights for Investors
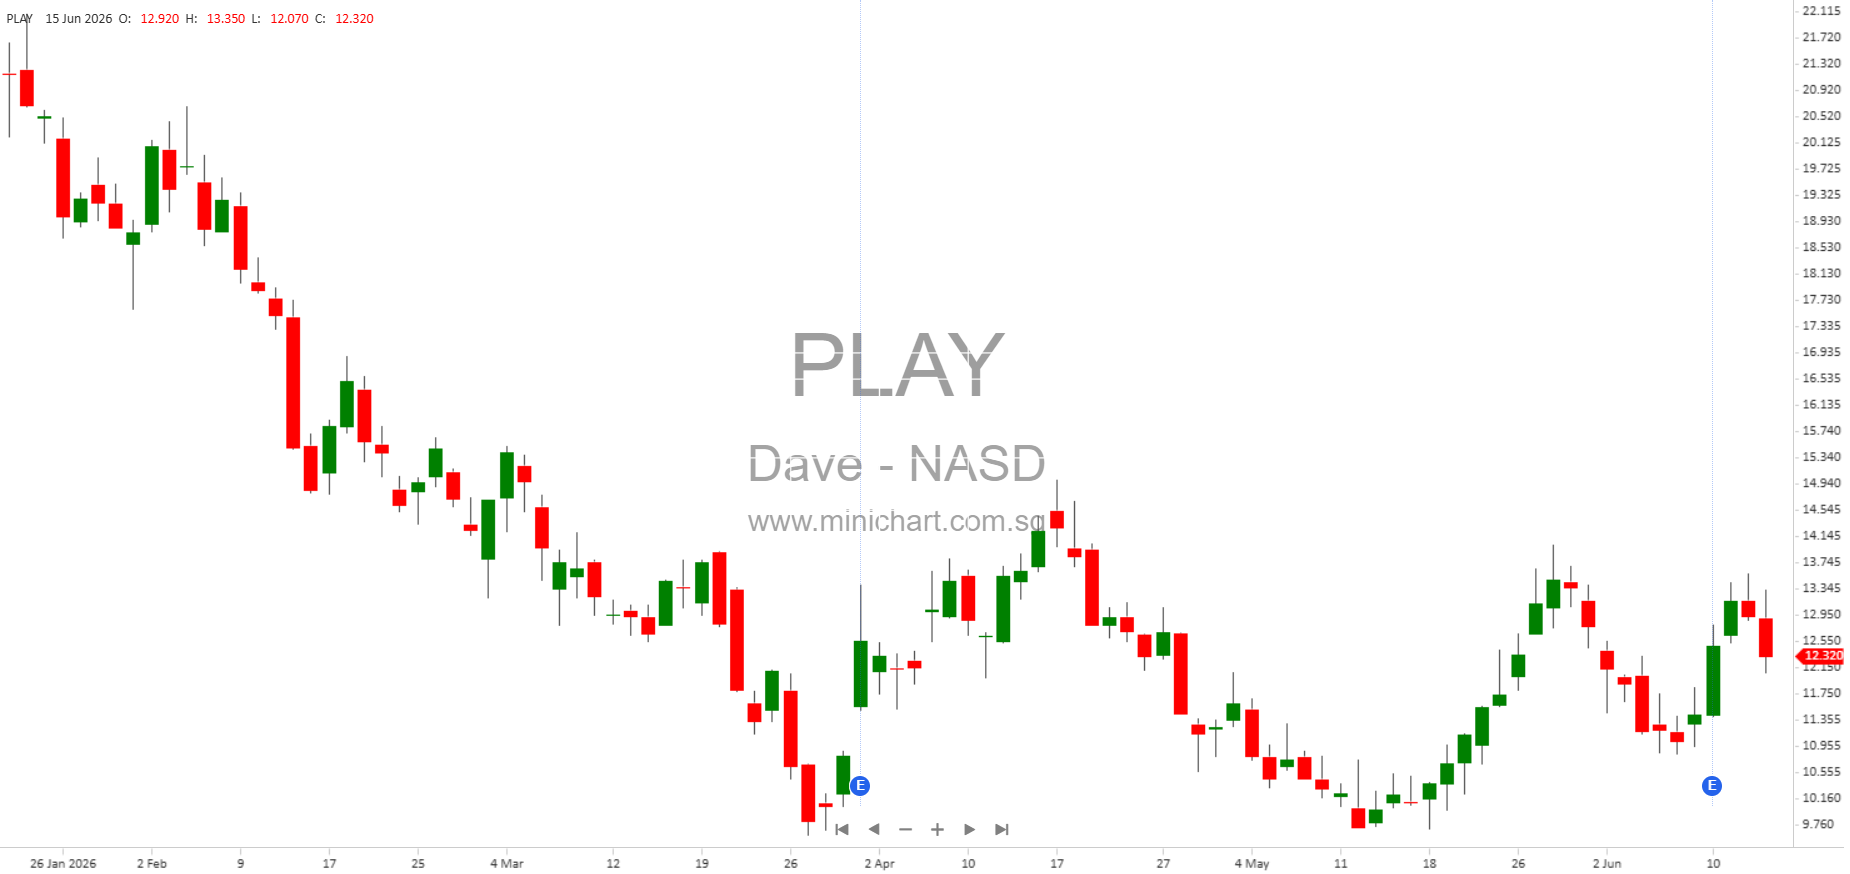
Dave & Buster’s Entertainment, Inc. (NASDAQ: PLAY) has released its Form 10-Q for the quarter ended May 5, 2026. The following article provides an in-depth analysis of the company’s latest financial performance, key developments, and important matters that shareholders should closely monitor.
Key Financial Highlights
- Net Income: Dave & Buster’s reported net income of \$5.7 million for the three months ended May 5, 2026, a significant decline from \$21.7 million in the same quarter last year.
-
Earnings Per Share (EPS):
- Basic EPS: \$0.16 (Q1 2026) vs. \$0.63 (Q1 2025)
- Diluted EPS: \$0.16 (Q1 2026) vs. \$0.62 (Q1 2025)
- Total Revenues: Not explicitly stated in the provided pages, but the sharp decline in net income and EPS signals either lower revenues or higher costs.
- Comprehensive Income: Total comprehensive income for the period was \$5.9 million, also down sharply from \$22.1 million for the comparable prior-year period.
-
Weighted Average Shares Outstanding:
- Basic: 34.66 million (Q1 2026) vs. 34.74 million (Q1 2025)
- Diluted: 34.94 million (Q1 2026) vs. 35.00 million (Q1 2025)
- Cash and Cash Equivalents: \$19.6 million as of May 5, 2026, up from \$16.6 million as of February 3, 2026.
- Total Assets: \$4.136 billion as of May 5, 2026.
- Stockholders’ Equity: \$99.6 million as of May 5, 2026, up slightly from \$91.2 million as of February 3, 2026.
Other Key Developments & Shareholder Information
- Share Repurchase Program: The company continued its share buyback activities, with treasury stock at cost totaling \$1.147 billion as of May 5, 2026. During the quarter, 1.04 million shares were repurchased at a cost of \$24.1 million.
- Capital Expenditures: The company made significant investments, with capital expenditures totaling \$105.3 million in Q1 2026. This is a material outflow and suggests ongoing investment in store openings, renovations, or technology.
- Cash Flow: Net cash provided by operating activities was strong at \$113.8 million, up from \$95.8 million in the same period last year, despite the fall in net income.
- Balance Sheet Strength: The company maintains a healthy liquidity position, but the relatively modest cash balance compared to the size of assets and treasury stock may warrant close monitoring.
- Share Count: As of June 10, 2026, the company had 34.79 million shares outstanding.
- Stockholder Equity Remains Low: Despite the company’s size, stockholders’ equity remains relatively low, implying high leverage due to debt or significant treasury stock. This could impact the company’s flexibility in future investments or shareholder returns.
Matters of Importance to Shareholders
- Significant Drop in Profitability: The sharp year-over-year decline in net income and EPS is a major red flag. Investors should seek management’s explanation for this decline—whether due to falling revenues, rising costs, or one-off charges. Such a drop could have a negative impact on share prices if not adequately addressed or if it signals ongoing challenges.
- Continued Share Buybacks: The company’s commitment to repurchasing shares, even during a period of falling profits, may support share prices in the near term. However, if buybacks are funded with debt or at the expense of capital needed for operations, this could be a concern for long-term shareholders.
- Heavy Capital Spending: The high level of capital expenditures, coupled with declining profits, could be a double-edged sword. While investment in growth is positive, investors should watch for returns from these investments and whether they are producing increased sales or operational efficiencies.
- Balance Sheet and Liquidity: The company’s overall liquidity appears stable, but leverage remains high and equity is low relative to assets. Any deterioration in cash flows or increased leverage could become price sensitive.
- No Preferred Stock Issued: The company is authorized to issue up to 50 million shares of preferred stock but has none outstanding, maintaining flexibility for future capital raises if needed.
- Classification: Dave & Buster’s is classified as a “Large Accelerated Filer,” not a smaller reporting company or emerging growth company.
Potential Price-Sensitive Issues
- Profitability Concerns: The drop in quarterly net income from \$21.7 million to \$5.7 million and EPS from \$0.63 to \$0.16 is significant and could negatively affect investor sentiment and share price.
- Balance Sheet Leverage: The persistently low equity compared to overall assets, alongside large treasury stock holdings, suggests the company could be highly leveraged, which may raise concerns over financial flexibility and risk.
- Heavy Capex During Profit Decline: High capital expenditures in a period of profit decline may trigger questions about capital allocation and returns on investment.
- Share Repurchases: Ongoing buybacks may support the stock but could also signal management’s focus on financial engineering over operational growth if not matched by improved performance.
Summary Table: Key Metrics
| Metric | Q1 2026 | Q1 2025 |
|---|---|---|
| Net Income (\$M) | 5.7 | 21.7 |
| EPS Basic | 0.16 | 0.63 |
| EPS Diluted | 0.16 | 0.62 |
| Comprehensive Income (\$M) | 5.9 | 22.1 |
| Cash & Equivalents (\$M) | 19.6 | 16.6 |
| Stockholders’ Equity (\$M) | 99.6 | 91.2 |
| Shares Outstanding (M) | 34.79 | 34.75 |
| Capital Expenditures (\$M) | 105.3 | 154.6 |
| Treasury Stock at Cost (\$M) | 1,146.6 | 1,120.6 |
Conclusion
The first quarter of 2026 shows several concerning trends for Dave & Buster’s investors: a sharp drop in profitability, ongoing heavy capital spending, and high stock repurchases even as profits decline. While the company maintains positive operating cash flow and liquidity, the combination of declining net income and high leverage may weigh on future share performance. Investors should look for management’s commentary on the drivers of profit decline, plans for capital allocation, and any strategic initiatives to address these challenges.
Disclaimer: This article is for informational purposes only and does not constitute investment advice. Investors should conduct their own due diligence and consult with a financial advisor before making any investment decisions. All financial data is as reported by Dave & Buster’s Entertainment, Inc. in its Form 10-Q for the quarter ended May 5, 2026.