Navan, Inc. Reports Q1 2026 Results: Loss Narrows, Revenue and Cash Position Strong, Key Risks Remain
Key Highlights from Navan’s Q1 2026 Quarterly Report
- Net Loss Narrows Significantly: Net loss for the quarter ended April 30, 2026 was \$20.5 million, a considerable improvement from the net loss of \$61.3 million in the same quarter last year.
- Revenue and Cash Position:
- Cash and cash equivalents: \$908.1 million as of April 30, 2026.
- Short-term investments: \$162.2 million.
- Total assets: \$1.71 billion.
- Total stockholders’ equity: \$1.24 billion.
- Operating Expenses:
- Research and Development: \$33.0 million (down from \$31.4 million last year).
- General and Administrative: \$41.7 million (down from \$47.5 million last year).
- Sales and Marketing: \$42.5 million (down from \$52.7 million last year).
- Weighted-Average Shares Outstanding: 250.3 million shares.
- Net Loss Per Share: \$(0.08) basic and diluted, a significant improvement from \$(1.33) per share in Q1 2025.
Potentially Price Sensitive Information for Shareholders
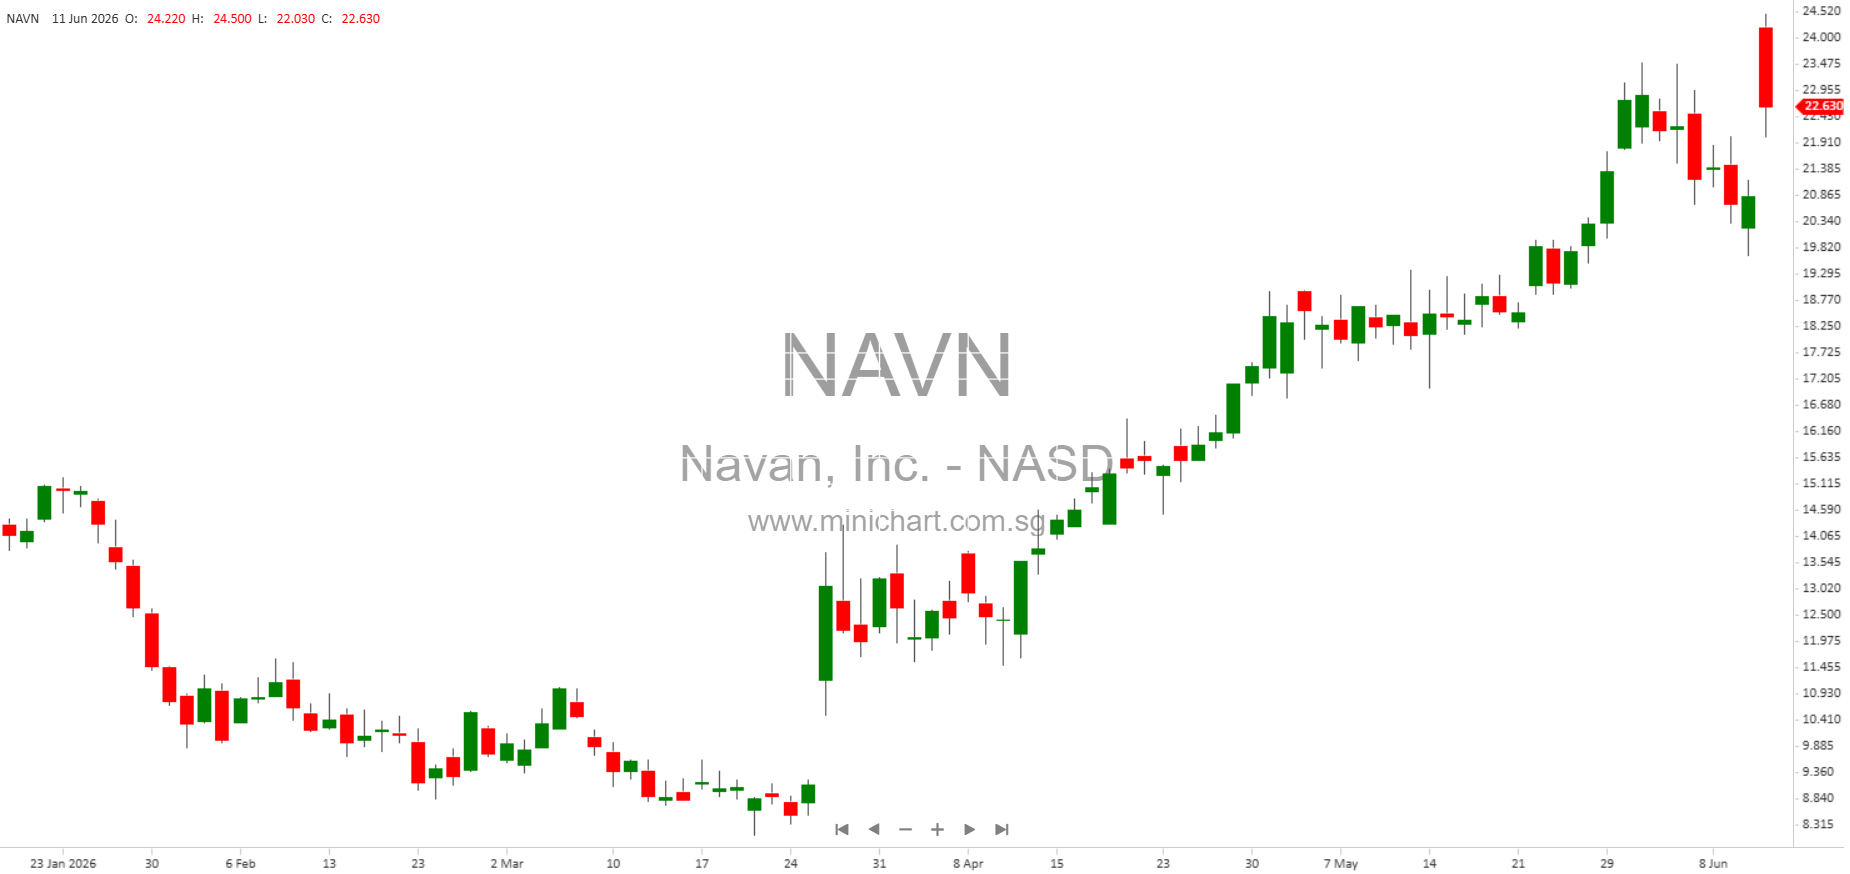
- Improvement in Financial Performance: Navan’s net loss has narrowed sharply year-over-year, suggesting improved operational efficiency or revenue growth. This trend may positively impact investor sentiment and share price.
- Strong Cash Position: The company maintains over \$1 billion in liquidity (cash and short-term investments), providing a solid buffer for continued operations, investment, and potential growth initiatives.
- Risk Factors:
- History of Operating Losses: Navan has not yet achieved profitability and warns that it may not become profitable or sustain profitability in the future.
- Fluctuating Results: The company’s results of operations may continue to fluctuate, making future performance difficult to predict and potentially increasing volatility in the share price.
- Internal Controls: There is a risk of material weaknesses in internal controls which could lead to misstatements or restatements of financials.
- Concentrated Voting Power: The dual-class stock structure gives co-founders Ariel Cohen and Ilan Twig outsized voting control, potentially limiting other shareholders’ influence over key decisions.
- Macroeconomic Uncertainty: Navan cites potential impact from inflation, global conflicts, interest rate volatility, and broader economic trends, which could affect travel demand and the company’s growth.
Detailed Financial Position (as of April 30, 2026)
| Item | Q1 2026 | Q1 2025 |
|---|---|---|
| Cash & Cash Equivalents | \$908,147,000 | – |
| Short-term Investments | \$162,199,000 | – |
| Total Assets | \$1,714,177,000 | \$1,708,761,000 |
| Total Current Assets | \$1,306,987,000 | – |
| Total Stockholders’ Equity | \$1,236,616,000 | \$1,208,061,000 |
| Net Loss | \$(20,506,000) | \$(61,257,000) |
| Net Loss per Share (Basic & Diluted) | \$(0.08) | \$(1.33) |
| Weighted-Average Shares Outstanding | 250,281,201 | 46,145,251 |
| Research & Development Expenses | \$33,098,000 | \$31,402,000 |
| Sales & Marketing Expenses | \$42,472,000 | \$52,723,000 |
| General & Administrative Expenses | \$41,684,000 | \$47,512,000 |
Summary of Risks and Forward-Looking Statements
- Navan cautions that its forward-looking statements are subject to numerous risks and uncertainties, including macroeconomic factors, industry trends, and operational challenges.
- The company operates in a highly competitive, rapidly changing environment, and there can be no assurance that anticipated results will be achieved.
- Shareholders should be aware of the potential for continued volatility and the need for ongoing monitoring of the company’s internal controls and governance structure.
Conclusion
Navan’s Q1 2026 results highlight a company moving closer to profitability, with a strong cash position and narrowing losses. However, persistent risks—ranging from macroeconomic headwinds to internal controls and governance—remain important for investors to monitor. The improvement in financial performance and robust liquidity could be seen as positive catalysts for the share price, but risks and structural factors such as voting concentration may temper investor enthusiasm.
Disclaimer: This article is for informational purposes only and does not constitute investment advice. Investors should review the full quarterly report and consult with their own financial advisors before making investment decisions. Past performance is not indicative of future results.