Lennar Corporation Reports Q2 2026 Results: Navigating Headwinds with Resilience
Key Highlights
- Net earnings per diluted share: \$1.24 (\$1.31 excluding mark-to-market losses on technology investments)
- Net earnings: \$305 million
- New orders: 21,749 homes, a decrease of 4% year over year
- Backlog: 16,818 homes, valued at \$6.6 billion
- Deliveries: 20,519 homes, up 2% year over year
- Total revenues: \$7.9 billion
- Gross margin on home sales: 15.6% (improved sequentially)
- SG&A expenses as % of home sales revenues: 9.2%
- Net margin on home sales: 6.4%
- Financial Services operating earnings: \$100 million
- Multifamily operating earnings: \$18 million (reversed from prior period’s loss)
- Cash and cash equivalents (Homebuilding): \$1.8 billion
- No outstanding borrowings under \$3.1 billion revolving credit facility
- Homebuilding debt to total capital: 15.8%
- Share repurchases: 5 million shares for \$447 million
- Redeemed: \$400 million of 5.25% senior notes due June 2026
Detailed Financial and Operational Analysis
Quarterly Performance
Lennar reported Q2 2026 net earnings of \$305 million, or \$1.24 per diluted share (or \$322 million, \$1.31 per share, excluding \$23 million in mark-to-market losses on tech investments). This compares with \$477 million, or \$1.81 per share (\$499 million, or \$1.90 per share, excluding \$29 million in similar losses) in Q2 2025. The company’s results reflect persistent market headwinds, including elevated mortgage rates, constrained affordability, and cautious consumer sentiment, further challenged by geopolitical uncertainty and a 4.2% resurgent inflation rate driven by higher energy prices.
Operational Strengths
- Delivered 20,519 homes (within guidance of 20,000–21,000), and generated 21,749 new orders.
- Average sales price was \$371,000, reflecting approximately 12.9% in incentives and necessary base price adjustments to sustain volume in a challenging market.
- Gross margin improved sequentially to 15.6%, while net margin increased to 6.4%.
- Construction costs improved by another 2% sequentially and 13% over the past several years.
- Cycle time reached a record low of 121 days, down from 132 days a year ago.
- Inventory reduced to 2.1 homes per community from 3 last quarter; inventory turn stands at 2.5 times.
- Less than 5% of land is on balance sheet, with total owned homebuilding inventory declining from \$11.4 billion a year ago to \$10.9 billion.
- Ended the quarter with \$1.8 billion in cash and repurchased 5 million shares for \$447 million.
Guidance and Outlook
- Q3 2026 Guidance:
- Deliveries: 20,500 – 21,500 homes
- Gross margin on home sales: ~16%
- Average sales price: \$375,000 – \$380,000
- SG&A as % of home sales: 8.8% – 9.0%
- Financial Services operating earnings: \$95–100 million
- FY 2026 Guidance:
- Moderated target full-year deliveries to approximately 82,000–83,000 homes (down from prior guidance, reflecting current market realities).
Segment Performance
- Home Sales: \$7.6 billion (down 2% YoY), primarily due to a 5% decrease in average sales price, partially offset by a 2% increase in deliveries.
- Gross margin: \$1.2 billion, or 15.6% (down from 17.8% in Q2 2025) due to lower revenue per sq. ft. and higher land costs, partially offset by construction cost reductions.
- SG&A expenses: \$698 million (9.2% of home sales, up from 8.8% in Q2 2025), reflecting lower leverage and higher marketing/selling costs.
- Financial Services: \$100 million operating earnings (down from \$157 million), primarily due to lower profit per locked loan in mortgages.
- Multifamily: \$18 million operating earnings (compared to a \$15 million loss last year).
- Lennar Other: \$39 million operating loss (vs. \$53 million loss), mainly from technology investment mark-to-market losses.
Balance Sheet and Liquidity
- Homebuilding cash and cash equivalents: \$1.8 billion
- No borrowings under \$3.1 billion revolving credit facility
- Homebuilding debt to total capital: 15.8% (Net homebuilding debt to total capital: 9.4%)
- Redeemed \$400 million of senior notes due June 2026 after the quarter end
- Stockholders’ equity: \$21.6 billion
Strategic Initiatives
- Lennar will release a new Investor Deck detailing its asset-light operating model, technology platform, and path to margin recovery and long-term value creation.
- Management continues to focus on operational execution, cost reductions, and maintaining flexibility amid macro uncertainty. The company is prioritizing volume to create scale advantages, reduce costs, and improve margins.
Important Price-Sensitive Developments for Shareholders
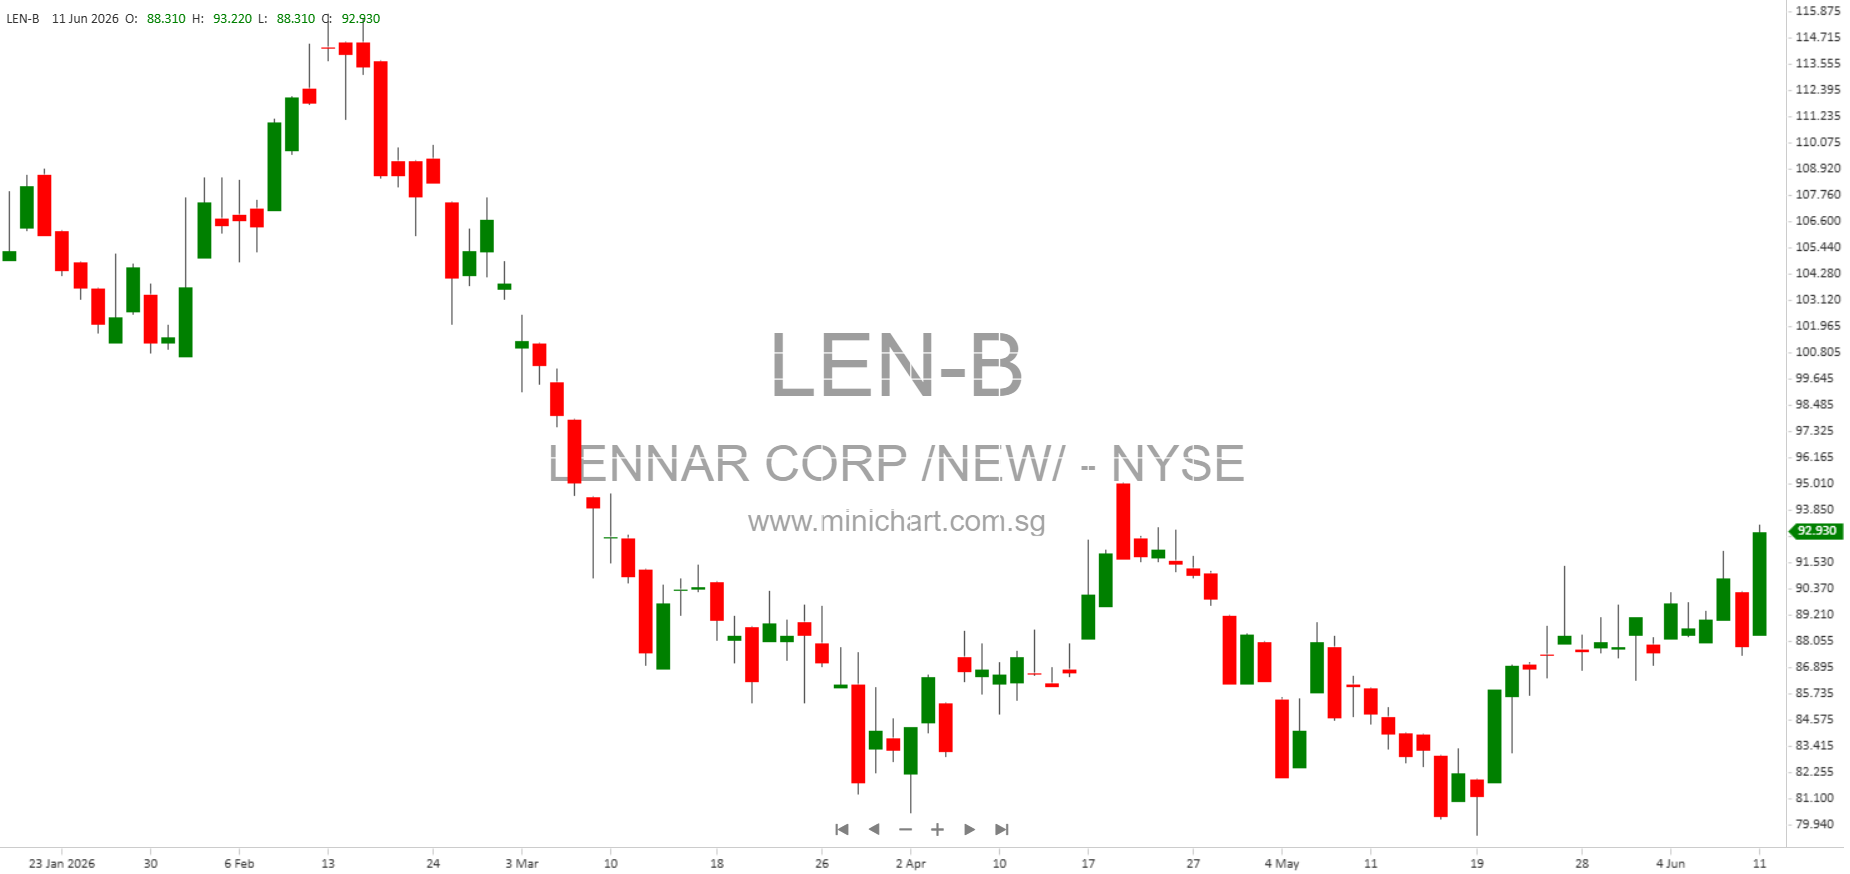
- Downward revision of full-year delivery guidance to 82,000–83,000 homes (previous guidance implied higher volume). This reflects management’s view of ongoing affordability constraints and macro uncertainty—potentially negative for share price if investors were expecting higher growth.
- Large share buybacks (5 million shares for \$447 million) may support the stock price and signal management’s confidence in long-term value.
- Gross margin improvement and further cost reductions—if sustained—could drive future profit recovery and re-rating of the stock.
- Reduction in owned homebuilding inventory and balance sheet de-risking (asset-light model) could be viewed positively by investors focused on capital efficiency and risk management.
- Operational improvements, such as record-low cycle times and narrowing incentive levels, indicate execution strength amid a challenging market environment.
- Publication of a new Investor Deck to communicate operating strategy and long-term vision may affect investor sentiment.
Risks and Forward-Looking Statements
Lennar’s management highlighted ongoing risks, including persistent inflation, elevated mortgage rates, affordability constraints, and geopolitical uncertainty. The company cautions that these factors could impact home demand, margins, and overall results. Investors should be aware of these risks, as well as potential supply chain and labor shortages, regulatory changes, and market volatility.
Conference Call Information
Lennar will hold a conference call to discuss Q2 2026 results at 11:00 a.m. ET on June 12, 2026. The call will be webcast on the company’s investor relations website, with a replay available for 90 days.
Conclusion
Lennar’s Q2 2026 report evidences strong operational execution and cost discipline, even as macroeconomic and housing market headwinds persist. While the reduction in full-year delivery guidance may weigh on investor sentiment, continued margin improvements, share buybacks, and a robust balance sheet provide reasons for longer-term optimism. Shareholders should closely monitor management’s execution on its asset-light, technology-driven strategy and any changes in housing market conditions that could affect future performance.
Disclaimer: This article is for informational purposes only and does not constitute investment advice. All forward-looking statements are subject to risks and uncertainties that may cause actual results to differ materially. Investors should review official filings and consult their financial advisors before making any investment decisions.