Friedman Industries Reports Record FY2026 Results: Earnings Surge, Sales Hit New Highs
Key Highlights from the FY2026 Report
- Record Net Earnings: FY2026 net earnings reached \$19.5 million, more than tripling the prior year’s result.
- EBITDA at All-Time High: EBITDA for the year soared to \$34.3 million, up from \$13.9 million last year.
- Sales Growth: Sales for the fiscal year ended March 31, 2026, rose by a remarkable 46% to \$266.9 million.
- Volume Expansion: Sales volume grew by 22% over FY2025, setting a new company record.
- Q4 Strength: Fourth quarter net earnings were \$9.2 million, with quarterly EBITDA of \$15.2 million.
- Quarterly Sales Volume: Q4 sales volume increased 6% over Q3 and was up 14% from the prior-year Q4.
- Strong Balance Sheet: Stockholders’ equity climbed to \$151.5 million as of March 31, 2026, up from \$132.4 million a year before.
Details and Analysis
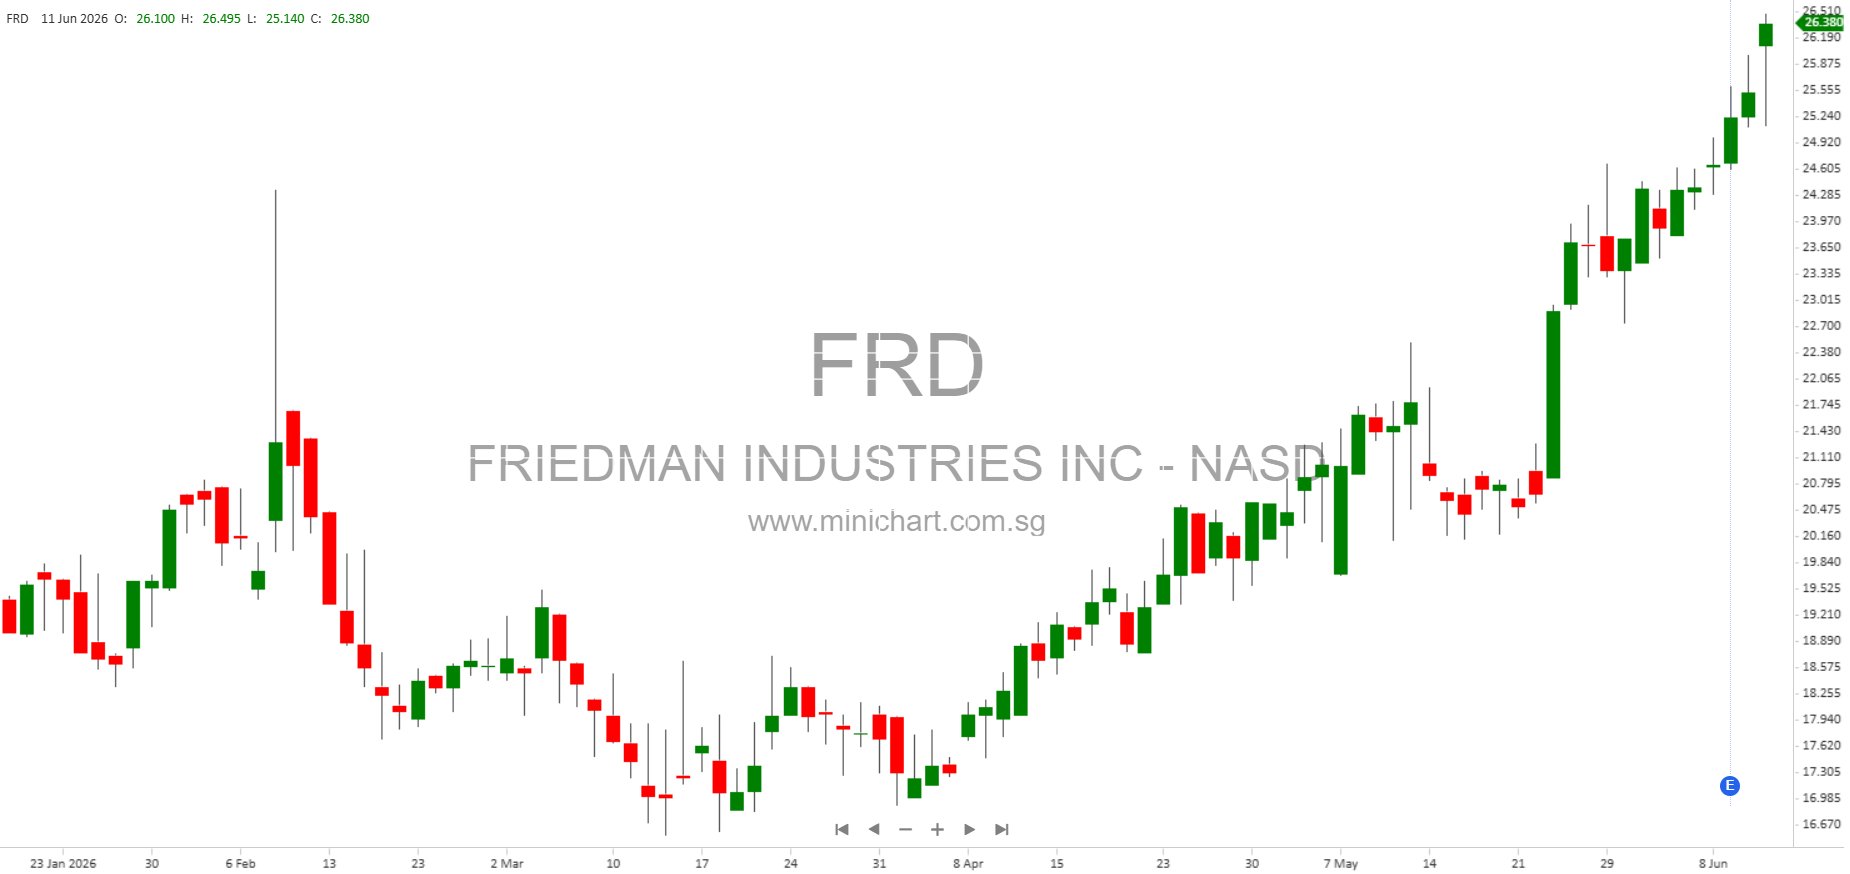
Friedman Industries, Incorporated (NASDAQ: FRD), headquartered in Longview, Texas, announced on June 11, 2026, its financial results for both the fourth quarter and full year ended March 31, 2026. These results mark a significant and positive inflection point for the company, with several metrics reaching all-time highs.
Financial Performance
- Net Earnings: For FY2026, Friedman posted net earnings of \$19.5 million, a dramatic increase from \$6.1 million in FY2025. This improvement was also reflected in the fourth quarter, where net earnings reached \$9.2 million, compared to \$5.3 million in Q4 FY2025.
- EBITDA: EBITDA, an important measure of operational performance, shot up to \$34.3 million for the year (FY2025: \$13.9 million). For Q4 alone, EBITDA was \$15.2 million.
- Sales: Sales for the fiscal year hit \$266.9 million, representing a 46% increase year-over-year. This was driven by strong end-market demand and the company’s ability to capitalize on favorable steel market conditions.
- Sales Volume: The company recorded a 22% increase in sales volume from FY2025, setting a new high water mark for annual shipments. Q4 sales volume was also robust, up 14% year-over-year and 6% sequentially from Q3.
Income Statement Summary (Key Figures, in Thousands)
| Q4 FY2026 | Q4 FY2025 | FY2026 | FY2025 | |
|---|---|---|---|---|
| Net Earnings | \$9,222 | \$5,345 | \$19,533 | \$6,085 |
| EBITDA | \$15,173 | \$13,937 | \$34,293 | \$13,937 |
| Sales | \$91,800 | \$69,900 | \$266,900 | \$182,477 |
| Earnings Before Income Taxes | \$12,746 | \$7,922 | \$27,656 | \$8,412 |
| Income Tax Expense | (\$3,524) | (\$2,577) | (\$8,123) | (\$2,327) |
Balance Sheet Highlights
- Total Stockholders’ Equity: \$151.5 million (up from \$132.4 million as of March 31, 2025)
- Noncurrent Assets: \$79.8 million (FY2025: \$60.4 million)
Strategic and Shareholder-Relevant Points
- Growth Trajectory: Friedman’s record profitability and sales volumes underscore a strong growth trajectory. The company’s operational leverage and market positioning have enabled it to benefit from robust steel demand and favorable market pricing.
- Hedging Success: The company reported gains from its economic hedging activities, which contributed positively to earnings and reduced risk from steel price volatility.
- No Indication of Emerging Growth Company: Friedman is not classified as an emerging growth company, reflecting its established operational scale.
Potential Price-Sensitive Information
- Record Results: The magnitude of the year-over-year improvement in earnings, EBITDA, and sales is significant and likely to be seen as price-sensitive by the market. Investors may react positively to the record-setting performance and the strong outlook implied by the volume growth.
- Balance Sheet Strength: The substantial increase in total stockholders’ equity provides additional financial flexibility for future investments, potential dividends, or share buybacks, which can directly affect shareholder value.
Guidance and Forward-Looking Statements
Management cautions that forward-looking statements, including projections of future results and expectations, are subject to risks and uncertainties. Key risks include changes in steel demand and pricing, government policies, raw material availability, operational disruptions, and competitive pressures. Investors should not place undue reliance on forward-looking statements, as actual results may differ materially.
Contact Information
For further details, investors may refer to the Company’s Form 10-K filed with the SEC on June 11, 2026, or contact Alex LaRue, Chief Financial Officer, Secretary and Treasurer, at (903) 758-3431.
Disclaimer: This article summarizes material extracted from the company’s official SEC filings and press releases. The information is provided for informational purposes only and does not constitute investment advice. Investors should conduct their own due diligence and consult with professional advisors before making investment decisions. While efforts have been made to ensure accuracy, no guarantee is made as to the completeness or reliability of the information contained herein.