Designer Brands Inc. Reports Strong Q1 2026 Results: Earnings Beat Expectations, Gross Margin Expands
Key Highlights
- Net Sales: Q1 2026 net sales increased 1.4% to \$696.4 million, outperforming last year.
- Gross Margin: Significant expansion by 240 basis points, reaching 45.3% versus 42.9% in Q1 2025.
- EPS: Adjusted diluted earnings per share (“EPS”) of \$0.07, exceeding expectations and guidance; reported diluted EPS of \$0.02.
- Brand Portfolio Segment: Double-digit sales growth, up 19.4%, indicating robust demand and successful execution on strategic initiatives.
- Retail Segment: Stabilization observed, with comparable sales down only 1.2% (compared to -7.5% in Q1 2025), indicating a positive trend reversal.
- Profitability: Gross profit rose to \$315.3 million (up from \$294.5 million), adjusted net income at \$3.8 million.
- Liquidity: Cash and cash equivalents totaled \$50.1 million, with \$138.5 million available for borrowings. Debt reduced to \$475.3 million from \$522.9 million year-over-year.
- Inventory: Inventory management improved, with inventories at \$586.6 million, down from \$623.6 million last year.
- Store Count: Slight reduction in store footprint: 663 stores (down from 669), with total square footage dropping to 10,889k from 11,006k.
- 2026 Guidance: Reaffirmed guidance for FY2026: Net sales expected to range from down 1% to up 1%, diluted EPS expected between \$0.28 and \$0.38, trending towards the high end.
Detailed Financial Analysis
Segment Performance
- Brand Portfolio: Net sales jumped to \$114.5 million from \$95.9 million, and operating profit soared to \$15.4 million (13.5% margin) from \$1.9 million (2.0% margin), reflecting successful structural improvements and pricing discipline.
- Retail: Net sales nearly flat at \$626.7 million, but segment operating profit improved to \$51.3 million (8.2% margin) from \$40.0 million (6.4% margin).
- Consolidated: Operating profit at \$18.9 million, a dramatic swing from a \$7.9 million loss last year.
- Comparable Sales: Retail segment only down 1.2%, a marked improvement from previous year’s 7.5% decline. Brand Portfolio direct-to-consumer channel up 3.0%, compared to a 27.0% decline last year.
Balance Sheet and Cash Flow
- Cash Position: \$50.1 million, up from \$46.0 million.
- Debt: Reduced to \$475.3 million, reflecting improved capital structure.
- Inventory: Lower inventories (\$586.6 million vs \$623.6 million), indicating ongoing efficiency improvements and reduced risk of markdowns.
- Shareholders’ Equity: \$280.9 million, higher than last year’s \$263.5 million.
- Liquidity: \$138.5 million available under credit facility.
Store Footprint
- DSW: 518 stores (down 2), The Shoe Co.: 118 stores (down 3), Rubino: 27 stores (down 1).
- Total stores: 663 (down 6 from last year), with total square footage slightly declining, reflecting ongoing optimization of retail presence.
Restatements and Adjustments
- Restatements: Immaterial restatements due to incorrect duty rates applied to Topo branded products imported into the U.S. Impact is not material to consolidated financial statements, but prior period amounts have been adjusted for comparability.
- Non-GAAP Measures: Adjusted results exclude restructuring and integration costs, impairment charges, interest expense on under-reported import duties, and foreign currency transaction losses/gains, providing a clearer view of core operating performance.
Forward-Looking Statements and Risks
- Guidance: Company expects to achieve the high end of its fiscal 2026 EPS range (\$0.28-\$0.38), despite macroeconomic uncertainty.
- Risks: Management cites risks including economic volatility, supply chain disruptions, tariffs, inflation, changing consumer preferences, seasonality, competitive pressures, cybersecurity threats, IT system risks (including AI tools), and climate change impacts.
- Strategic Actions: Continued focus on inventory management, pricing discipline, sourcing, and channel profitability.
Potential Price-Sensitive Information for Shareholders
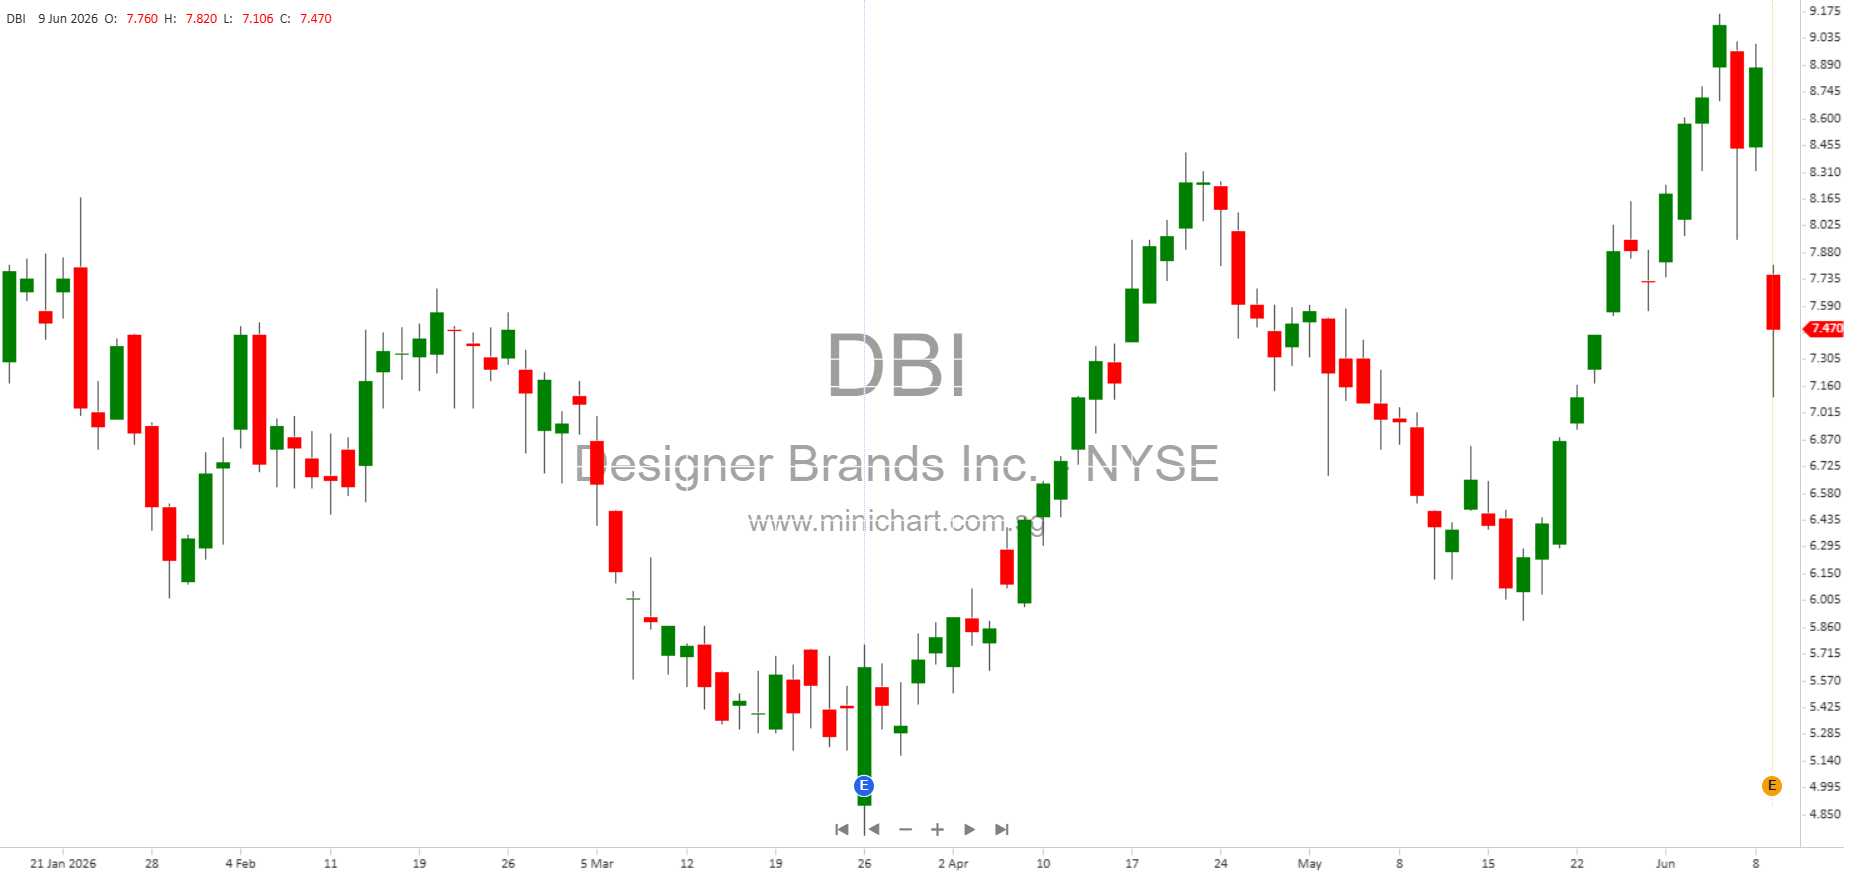
- Profitability Surges: Operating profit swinging from a loss to a positive result, and substantial improvement in gross margin, could signal a positive re-rating of the stock.
- Debt Reduction: Significant reduction in debt improves financial flexibility and lowers risk profile.
- Guidance Reaffirmed and Trending High: Management’s confidence in achieving the high end of EPS guidance may positively impact investor sentiment and share price.
- Brand Portfolio Growth: Double-digit growth in this segment signals successful execution on strategic priorities and potential for further upside.
- Restatements: While not material, the correction for import duties shows improved compliance and transparency, which may reassure investors.
- Store Optimization: Store count reduction and inventory management improvements could drive long-term profitability and margin expansion.
Other Notable Information
- Corporate Social Responsibility: Over thirteen million pairs of shoes donated globally since 2018, highlighting commitment to ESG values.
- Conference Call: Management to host call on June 9, 2026, for further discussion; webcast available for replay.
Conclusion
Designer Brands Inc. has delivered a strong start to fiscal 2026, with net sales growth, gross margin expansion, and profitability improvements across both Retail and Brand Portfolio segments. The company’s reaffirmed guidance and optimism for achieving the high end of the EPS range, along with strategic initiatives to enhance inventory management and store optimization, are likely to be viewed positively by investors. The results signal a turnaround in retail trends and successful execution on growth strategies, potentially driving share price appreciation. Management’s acknowledgment of key risks and transparent restatements further reinforce credibility.
Disclaimer: This article is for informational purposes only. It does not constitute investment advice, and investors should conduct their own due diligence. All forward-looking statements are subject to risks and uncertainties described in Designer Brands Inc.’s filings with the Securities and Exchange Commission. The author does not have any position in Designer Brands Inc. at the time of writing.