Science Applications International Corporation (SAIC) Reports Q1 2026 Earnings: Key Highlights for Investors
Science Applications International Corporation (SAIC) has released its unaudited financial results for the quarter ended May 1, 2026. Below are the critical highlights and details that shareholders and investors need to know, including several factors that could potentially impact the company’s share price.
Key Financial Highlights
- Revenues: SAIC reported revenues of \$2.07 billion for the quarter ended May 1, 2026.
- Net Income: The company recorded net income of \$68 million for Q1 2026, compared to \$115 million in the prior comparative period.
- Earnings Per Share (EPS):
- Basic EPS: \$1.43, down from \$2.63 in the prior period
- Diluted EPS: \$1.42, down from \$2.61 in the prior period
- Total Assets: \$5.35 billion as of quarter-end.
- Total Stockholders’ Equity: \$1.42 billion as of May 1, 2026, a decline from \$1.50 billion at the previous year-end.
Shareholder-Focused Details & Price-Sensitive Items
- Share Repurchases: SAIC was highly active in returning value to shareholders, repurchasing and retiring \$188 million worth of shares during the quarter. This is a significant capital allocation and may affect future EPS positively by reducing share count.
- Dividend Payments: The company paid \$17 million in cash dividends to common stockholders in the latest quarter, highlighting a continued commitment to shareholder returns. The dividend per share for the quarter was \$0.37.
- Stock-Based Compensation: The company incurred a charge of \$2 million related to stock-based compensation during the period.
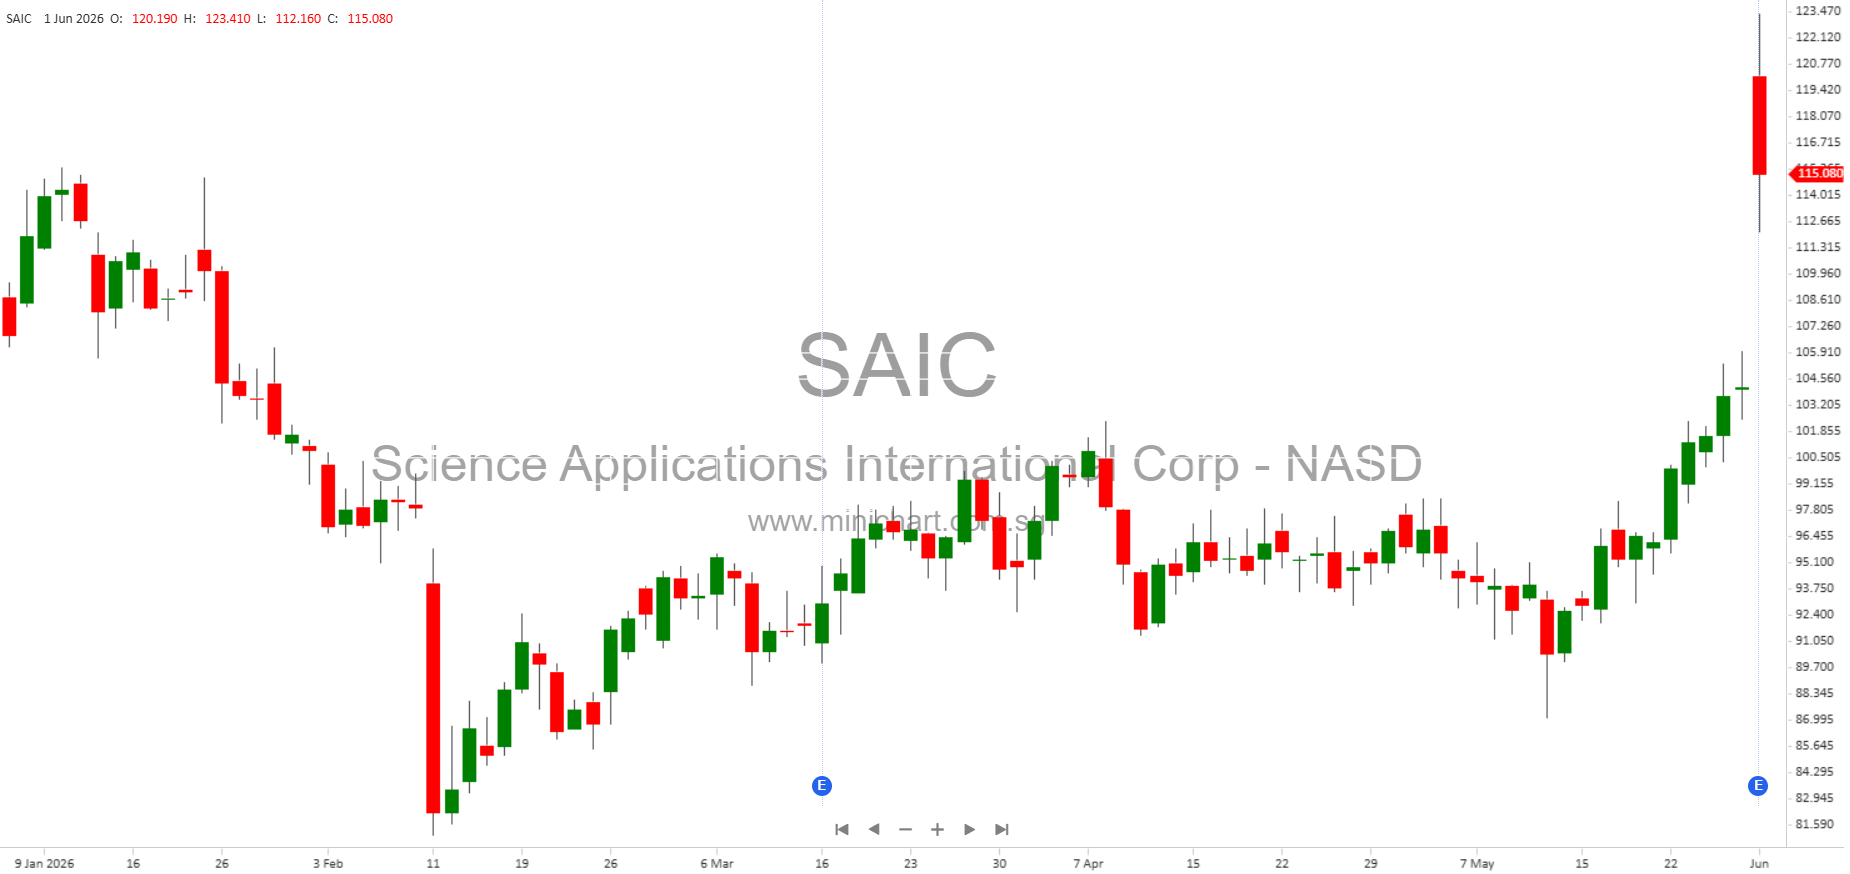
- Decrease in Net Income and EPS: The marked reduction in both net income and earnings per share compared to the previous year is a material development that may affect investor sentiment and potentially pressure the share price.
- Decline in Stockholders’ Equity: The decrease in equity from \$1.50 billion to \$1.42 billion could be attributed to the combination of share repurchases and lower net income, a dynamic that investors should monitor closely.
- Operating Cash Flow: Net cash provided by operating activities was \$100 million, well above the investing and financing outflows, demonstrating continued operational strength.
Other Notable Metrics and Disclosures
- Share Count: Number of common shares outstanding stood at 43 million at the end of the quarter, down from 44 million at the start of the quarter and 48 million at the prior year-end, driven by robust share repurchase activities.
- Investment Activities: The company generated \$15 million from sales of other investments and \$5 million from sales of marketable securities during the quarter.
- Balance Sheet Strength: Total assets at \$5.35 billion provide a substantial base, with liabilities and stockholders’ equity balanced at \$5.35 billion as well.
Potential Share Price Implications
- The combination of lower net income and EPS, ongoing share repurchases, and stable dividend payments represents a mixed bag for investors. Share repurchases and dividends support the share price, but declining profitability could weigh on valuation multiples.
- Active capital returns (buybacks and dividends) indicate continued management confidence in the business but must be balanced against the trend in operating performance.
- Investors should closely monitor upcoming management commentary and future quarters to assess whether the dip in profitability is a short-term fluctuation or part of a longer-term trend.
Summary Table
| Metric | Q1 2026 | Prior Year Period |
|---|---|---|
| Revenues | \$2.07B | N/A |
| Net Income | \$68M | \$115M |
| Basic EPS | \$1.43 | \$2.63 |
| Diluted EPS | \$1.42 | \$2.61 |
| Shares Outstanding | 43M | 48M (year start) |
| Stockholders’ Equity | \$1.42B | \$1.50B |
| Dividends Paid | \$17M | N/A |
| Share Repurchases | \$188M | N/A |
Conclusion
SAIC’s Q1 2026 report presents a company with a strong focus on returning value to shareholders through dividends and share repurchases, but also signals challenges in profitability as shown by declines in both net income and EPS. These developments are significant and could influence the direction of the company’s share price in the upcoming quarters. Investors should be attentive to further announcements and management’s strategic responses to the drop in earnings.
Disclaimer: This article is for informational purposes only and does not constitute investment advice. Investors should conduct their own due diligence or consult a qualified financial advisor before making any investment decisions. The information is based on the latest available company filings and may be subject to future updates or corrections.