Burlington Stores Reports Robust Q1 2026 Results: Double-Digit Sales and Earnings Growth, Upgraded Full-Year Outlook
Key Highlights from Q1 2026
- Total Sales: Increased 14% year-over-year to \$2.85 billion, building on a 6% increase in the prior year.
- Comparable Store Sales: Rose 6%, beating internal guidance.
- Net Income: \$115 million (\$1.79 diluted EPS), up from \$101 million (\$1.58 diluted EPS) in Q1 2025.
- Adjusted Net Income: \$134 million (\$2.10 adjusted EPS), a 26% increase vs. Q1 2025 (\$107 million, \$1.67 adjusted EPS).
- Adjusted EBIT Margin: Expanded by 20 basis points, driven by higher sales, improved gross margin, and supply chain leverage.
- Gross Margin Rate: Improved to 44.1% of net sales (vs. 43.8% in Q1 2025); merchandise margin grew 20bps, freight expense improved 10bps.
- Inventory: Merchandise inventories rose 10% to \$1.44 billion, reflecting 127 net new stores and an 11% increase in comparable store inventory.
- Liquidity: Ended Q1 2026 with \$1.69 billion in liquidity (\$747 million cash, \$942 million ABL facility availability).
- Debt Management: Repurchased \$111 million principal of Convertible Notes (settled with \$129 million cash and 150,831 shares), ended quarter with \$1.92 billion total debt.
- Share Repurchases: Bought back 257,906 shares (\$81 million); \$304 million remains authorized for repurchases.
Upgraded Guidance for Fiscal 2026
- Sales Growth: Expected 9%–11% increase (on top of 9% growth in FY 2025).
- Comparable Store Sales: Projected 2%–4% rise (on top of 2% in FY 2025).
- Store Expansion: Plan to open approximately 115 net new stores.
- Adjusted EBIT Margin: Forecasted to rise 10–30 basis points, excluding bankruptcy-acquired lease expenses.
- Adjusted EPS: Revised upward to \$11.45–\$11.80 (vs. \$10.17 in FY 2025), reflecting 13%–16% growth.
- Capital Expenditures: Net of landlord allowances, expected to be ~\$875 million.
- Tax Rate: Adjusted effective tax rate expected at ~25%.
- Second Quarter Outlook: Sales to rise 10%–12%, comparable sales up 1%–3%, adjusted EPS expected at \$2.05–\$2.20 (vs. \$1.72 last year).
Operational and Financial Details
- SG&A: Adjusted SG&A as a percentage of net sales was 26.8%, up slightly from 26.6% in Q1 2025.
- Effective Tax Rate: Lowered to 19.6% (adjusted rate at 20.1%), vs. 24.1% in Q1 2025.
- Adjusted EBITDA: \$284 million, up from \$244 million last year; Adjusted EBIT was \$179 million (vs. \$152 million).
- Reserve Inventory: Now 41% of total inventory, down from 48% last year, indicating more inventory being allocated to stores.
- Debt Profile: \$1,716 million in term loans, \$186 million in convertible notes, no borrowings on the ABL facility.
- Repurchase Program: Significant buybacks continue, with \$304 million authorization remaining, potentially supporting share price.
- Store Footprint: 1,042 stores as of Q1 2026, operating in 47 states, Washington D.C., and Puerto Rico.
Strategic and Shareholder-Relevant Points
- Consistent Double-Digit EPS Growth: Q1 marks the 14th consecutive quarter of double-digit EPS growth, underscoring operational strength and profitability.
- Guidance Passed Through Upside: Management is passing all Q1 upside to full-year guidance, reflecting confidence in continued momentum.
- Margin Expansion: Operating and gross margin improvements suggest efficiency gains and pricing power, which are key drivers of future earnings.
- Aggressive Store Expansion: Continued new store openings may fuel top-line growth and market share gains.
- Debt Reduction/Convertible Notes Repurchase: Strategic repurchase of convertible notes reduces dilution risk and improves capital structure.
- Share Repurchases: Ongoing buybacks can support share price and signal management confidence.
- Liquidity Position: Strong liquidity enables flexibility for investments, debt management, and return of capital to shareholders.
- Risk Factors: The report notes risks from economic conditions, competition, regulatory changes, supply chain, labor, cyber-security, and other factors that could materially impact results.
Potential Price-Sensitive Developments
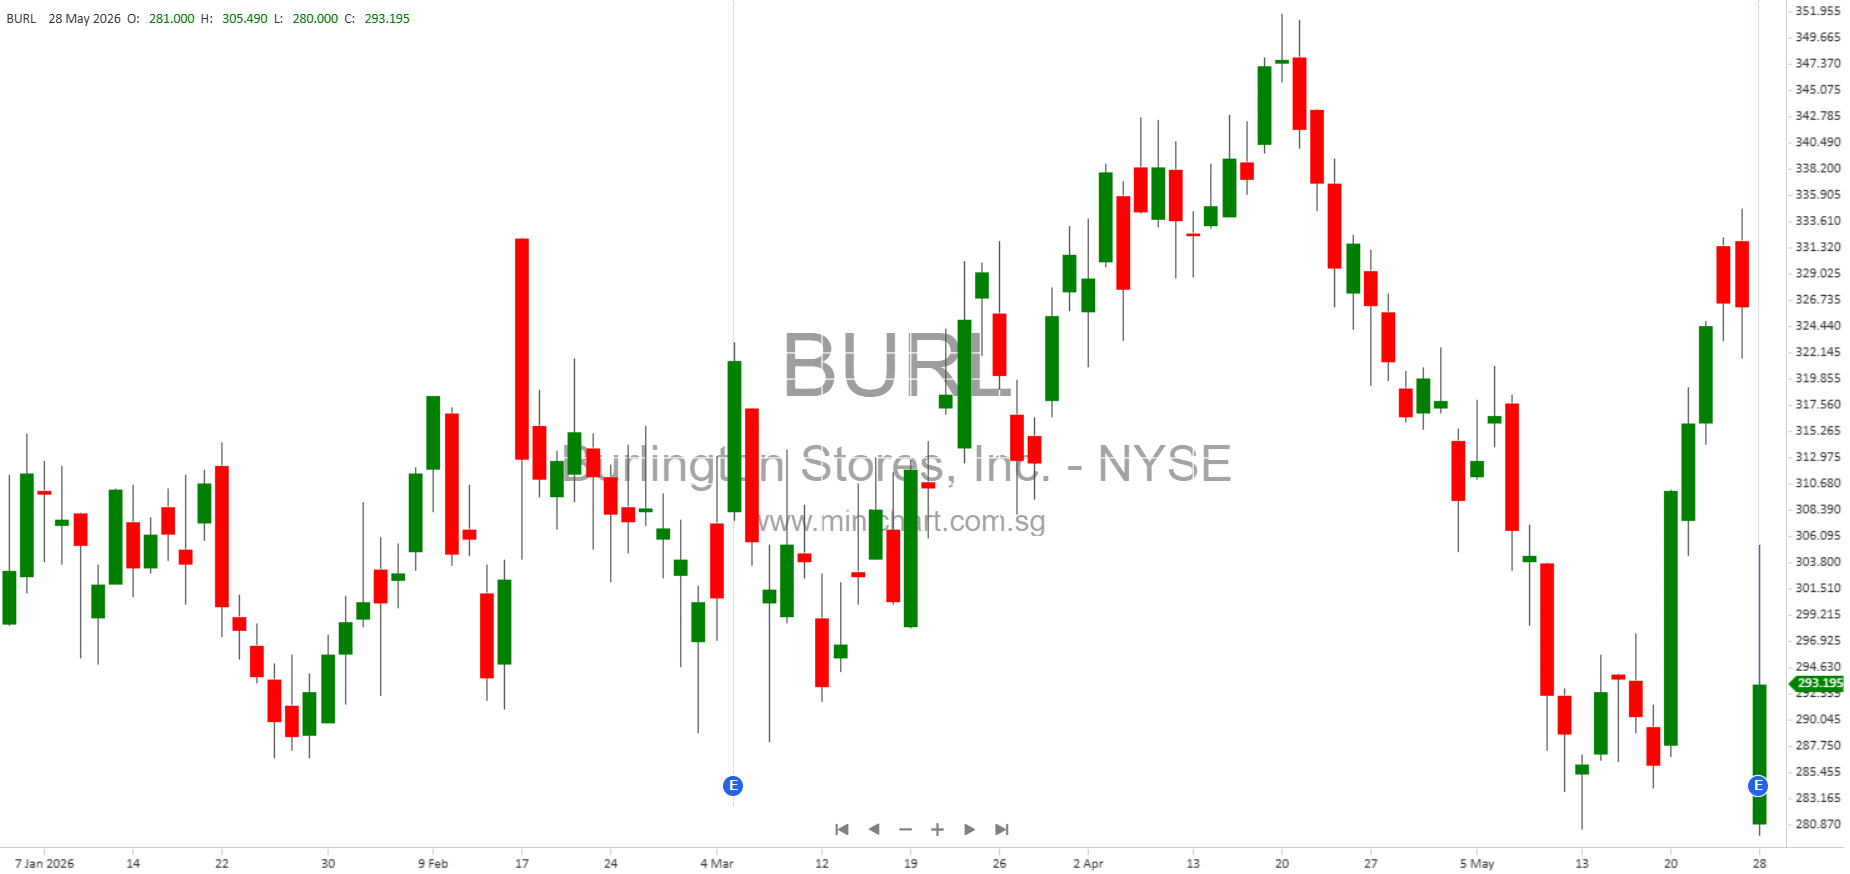
- Strong Sales/Earnings Beat: The quarter materially exceeded guidance, which is likely to positively impact investor sentiment and share price.
- Upgraded Full-Year Guidance: Passing through Q1 upside to full-year earnings and sales guidance is a bullish signal.
- Aggressive Share Repurchases: Continued buybacks and authorization remaining could provide support for the stock.
- Convertible Debt Repurchases: Reducing convertible debt exposure minimizes dilution and improves financial flexibility.
- Margin Expansion: Improvements in gross and operating margins suggest sustainable profitability gains.
- Store Expansion: Opening 115 net new stores demonstrates confidence in growth prospects and market opportunity.
Conference Call and Investor Information
Burlington will host its Q1 2026 earnings call on May 28, 2026 at 8:30 a.m. ET. Investors can dial in (U.S.: 1-800-715-9871, Int’l: 1-646-307-1963, passcode: 8704025), or access the webcast at www.burlingtoninvestors.com. A replay will be available until June 4, 2026.
For further investor relations inquiries, contact David J. Glick or Marisa Sharkey at 855-973-8445 or [email protected]. External contact: Allison Malkin (ICR, Inc.) at 203-682-8225.
About Burlington Stores
Burlington Stores, Inc., headquartered in New Jersey, is a Fortune 500 off-price retailer with FY 2025 net sales of \$11.5 billion. The company operates 1,042 stores as of Q1 2026, offering branded merchandise at up to 60% off other retailers’ prices.
Disclaimer
This article contains forward-looking statements based on Burlington Stores, Inc.’s current projections and expectations. Actual results may differ materially due to risks and uncertainties, including but not limited to economic conditions, competitive pressures, regulatory changes, supply chain disruptions, labor issues, and other factors outlined in the company’s SEC filings. Investors are advised to review the company’s risk disclosures and not rely solely on this article for investment decisions.