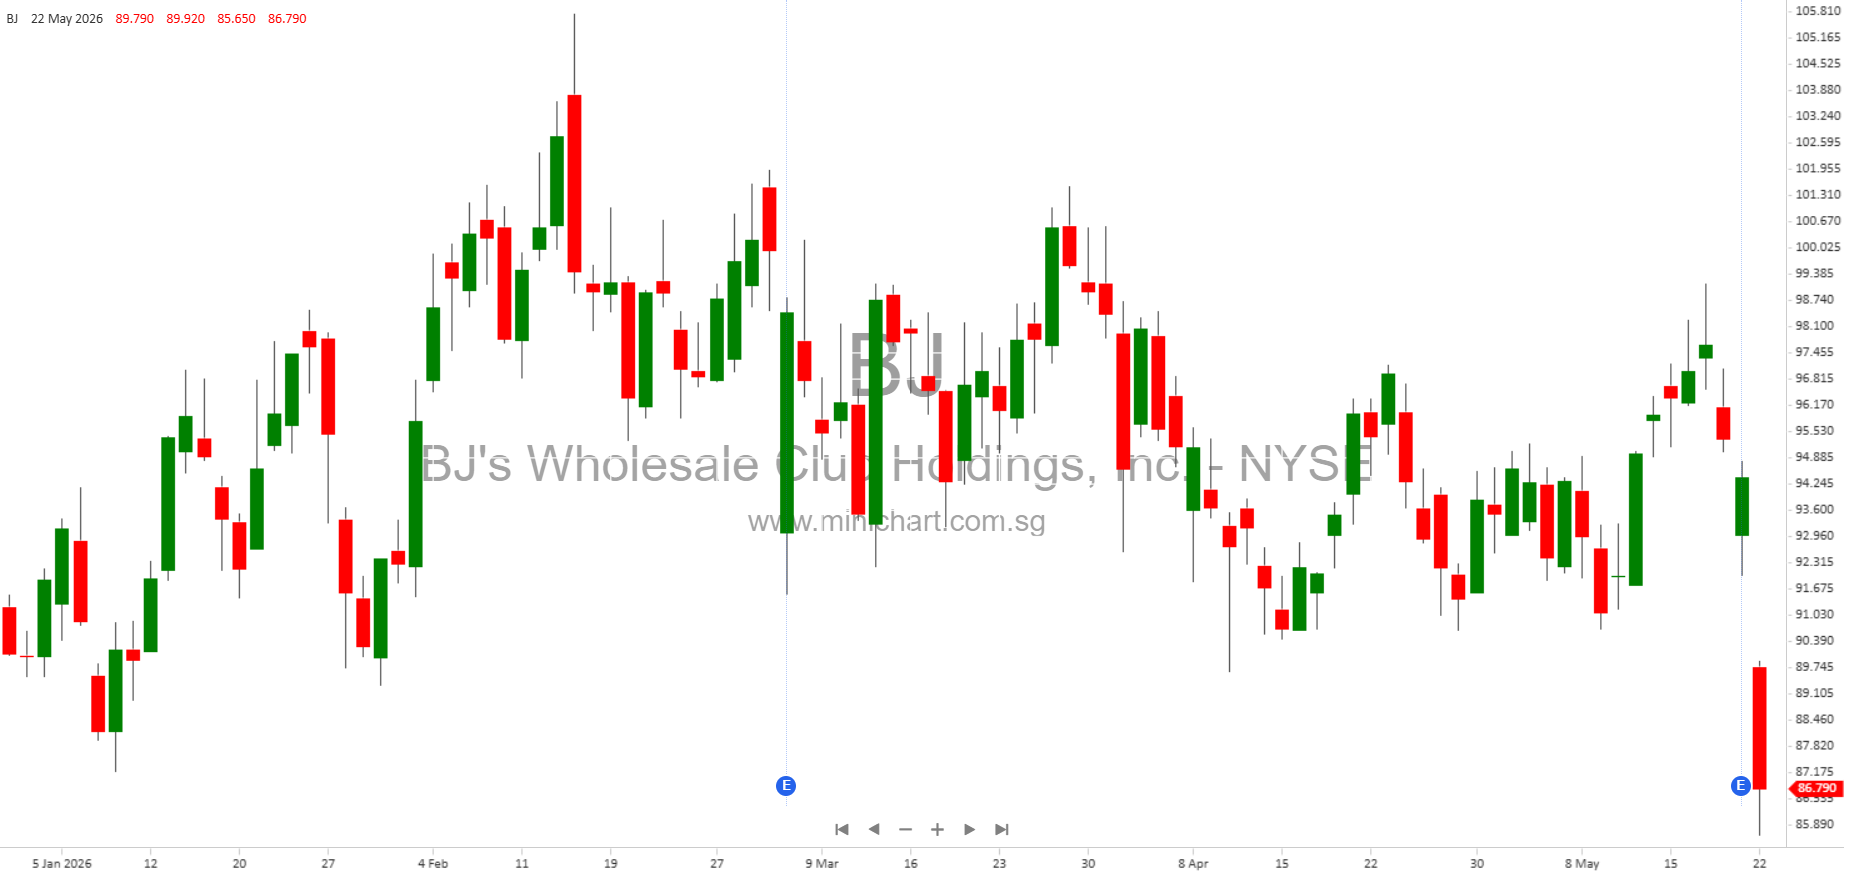
BJ’s Wholesale Club Holdings, Inc. Reports Strong Q1 2026 Results and Maintains Bullish Outlook
Key Points and Highlights
- Comparable club sales rose 6.3% year-over-year; excluding gasoline, comps up 1.5%.
- Membership fee income surged 9.9% to \$132.4 million.
- Digitally enabled comparable sales spiked 28%, with a two-year stacked growth of 63%.
- Earnings per diluted share and adjusted EPS at \$1.10.
- Net sales grew nearly 10% to \$5.53 billion.
- Operating income up 2.1%; adjusted EBITDA climbed 4.3% to \$298.1 million.
- Company repurchased 2.1 million shares for \$206.6 million. \$545 million remains in the buyback program.
- One new club and six new gas stations opened in the quarter.
- Guidance for fiscal 2026 unchanged; company expects adjusted EPS between \$4.40 and \$4.60.
- Capital expenditures for 2026 expected at ~\$800 million for continued growth and distribution enhancements.
Financial Performance Overview
BJ’s Wholesale Club Holdings, Inc. delivered a robust financial performance for the first quarter of fiscal 2026, demonstrating resilience and strong execution amid a challenging macro environment. Net sales increased by 9.9% to \$5.53 billion from \$5.03 billion a year ago. Total revenues, including membership fee income, also rose 9.9% to \$5.66 billion.
Membership fee income—a critical factor for the warehouse club model—jumped 9.9% year-over-year, reaching \$132.4 million. This was attributed to gains in membership acquisition, high retention rates, and more members upgrading to higher-tier memberships across both new and established clubs.
The company’s gross profit climbed to \$1.03 billion, up from \$969.5 million in Q1 2025. However, the merchandise gross margin rate (excluding gasoline and membership fee income) decreased by about 10 basis points, primarily due to continued investments in pricing, which were only partially offset by tariff refund benefits.
Profitability and Cost Management
Operating income posted a modest increase of 2.1% to \$207.9 million. Despite this, net income dropped 4.7% to \$142.7 million (from \$149.8 million last year), driven largely by a higher income tax expense (\$52.8 million vs. \$42.8 million last year) and increased SG&A expenses resulting from labor, occupancy, and opening new clubs and gas stations. Depreciation expense also rose due to an uptick in the number of company-owned clubs.
Adjusted EBITDA, a key measure watched by investors and analysts, increased 4.3% to \$298.1 million, reflecting the company’s ability to generate cash flow despite downward pressure on net income.
Digital and Strategic Momentum
Digitally enabled comparable sales growth was a standout, up 28% year-over-year and 63% on a two-year stacked basis, underscoring the success of BJ’s digital investments and omnichannel strategy. This segment continues to be a driver of incremental growth and positions BJ’s competitively within the warehouse club sector.
Shareholder Returns and Capital Allocation
During the first quarter, BJ’s continued to return value to shareholders, repurchasing 2,114,000 shares of common stock for \$206.6 million. As of quarter-end, the company still has approximately \$545 million authorized for future buybacks, providing flexibility for continued capital returns.
Outlook for Fiscal 2026
The company reaffirmed its positive outlook for fiscal 2026, projecting:
- Comparable club sales (ex-gasoline) growth of 2.0% to 3.0% year-over-year
- Adjusted EPS guidance of \$4.40 to \$4.60
- Capital expenditures around \$800 million, supporting new club openings and network enhancements
Management remains confident in the strategy and expects to deliver sustainable growth and profitability. The company’s disciplined execution, investment in digital and new locations, and strong membership momentum are all cited as factors underpinning this outlook.
Balance Sheet and Liquidity
- Cash and cash equivalents at quarter-end: \$27.8 million
- Total assets: \$7.93 billion
- Net debt: \$746.3 million
- Net debt to last twelve months (LTM) adjusted EBITDA: 0.6x, indicating strong borrowing capacity
- Current portion of debt and lease liabilities increased, reflecting strategic investments in property and equipment
Risks and Forward-Looking Statements
As with all forward-looking statements, management notes risks including economic volatility, inflation, supply chain disruptions, labor costs, execution of digital initiatives, and competition. Investors are encouraged to review risk factors outlined in recent SEC filings for a comprehensive understanding.
Shareholder-Relevant Insights and Potential Price Movers
- Accelerated membership growth and high retention rates, especially among higher-tier memberships, could sustain top-line expansion and margin resilience.
- Robust digital sales growth demonstrates BJ’s competitive positioning in e-commerce within the warehouse club market.
- Substantial ongoing buyback program and strong balance sheet support the potential for further shareholder returns.
- Unchanged and positive full-year guidance may reassure investors of management’s confidence despite some bottom-line pressure this quarter.
Conference Call Details
BJ’s will host a conference call to discuss these results at 8:30 A.M. ET on May 22, 2026. The webcast and presentation materials are available at the company’s investor relations site.
Disclaimer: This article is for informational purposes only and does not constitute investment advice. Forward-looking statements are subject to numerous risks and uncertainties that could cause actual results to differ materially. Investors are encouraged to consult BJ’s filings with the SEC and to seek professional advice before making investment decisions.