Broadwind, Inc. Reports Q1 2026 Results: Key Highlights and Investor Analysis
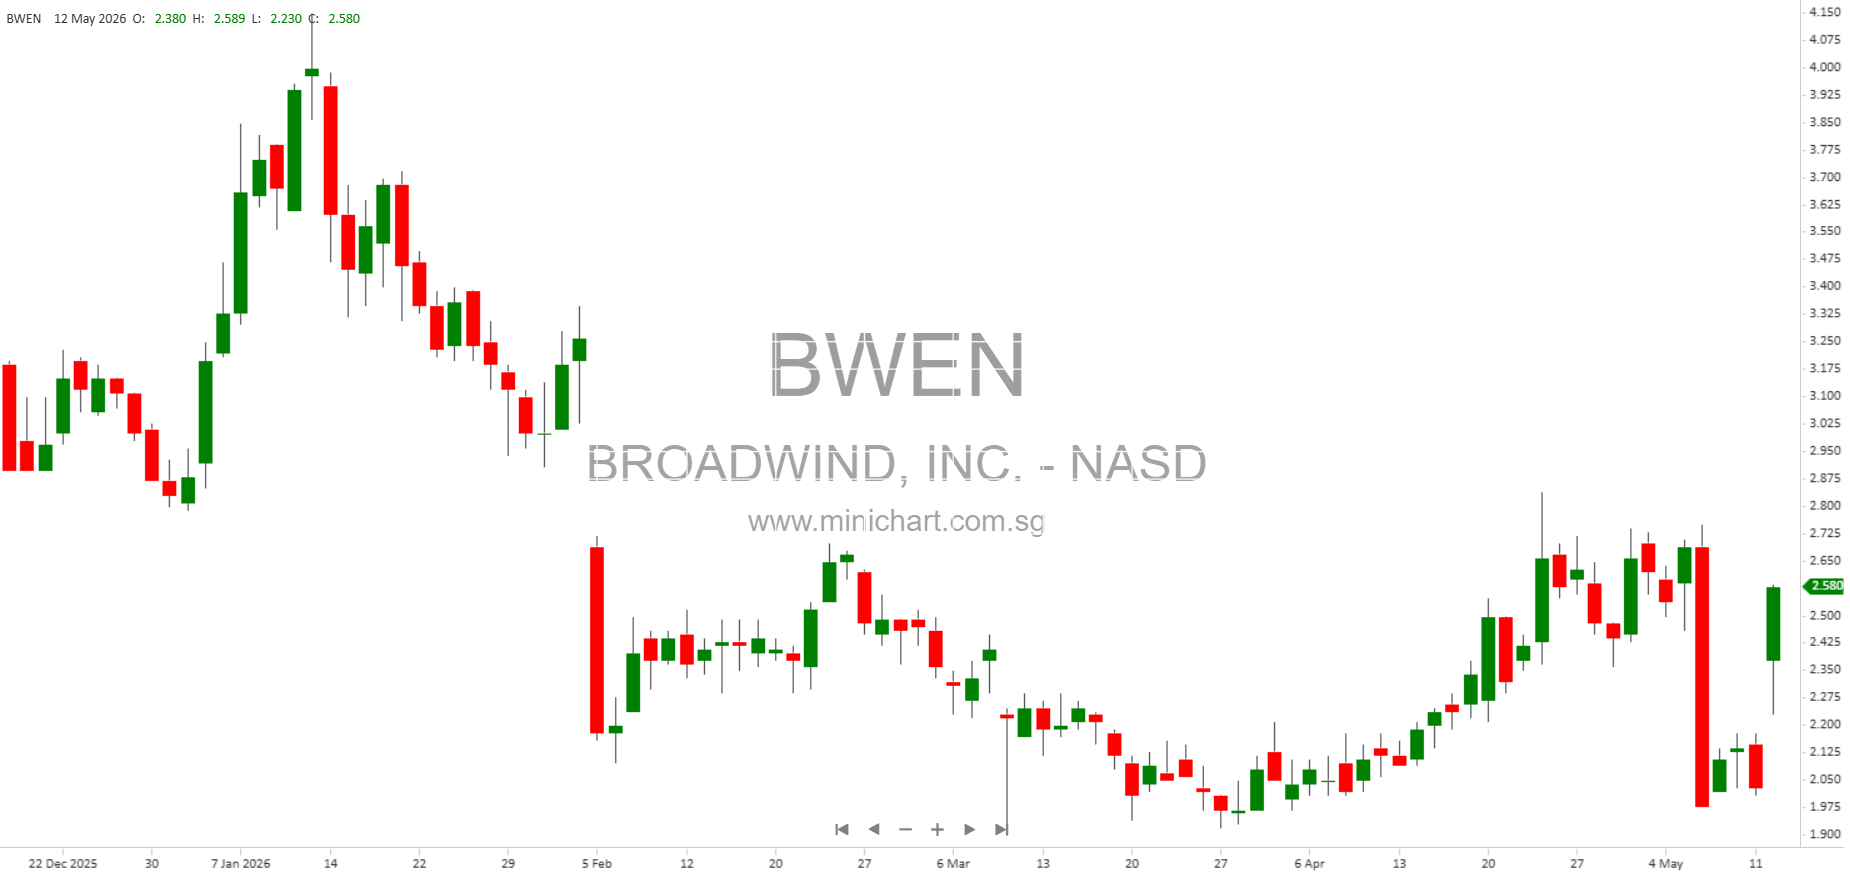
Broadwind, Inc. (NASDAQ: BWEN) released its financial results for the first quarter ended March 31, 2026, on May 12, 2026. The report includes the quarterly earnings, operational updates, and insights into the Company’s financial condition, as well as forward-looking statements and risk factors that may influence the stock price.
Key Points from the Q1 2026 Report
- Net Loss Reported: Broadwind recorded a net loss of \$495,000 for the first quarter of 2026, compared to a net loss of \$370,000 in the corresponding period of 2025. The net loss per basic and diluted share was \$(0.02) for Q1 2026 versus \$(0.02) in Q1 2025.
- Revenue Growth: Total revenues for Q1 2026 reached \$30.5 million, a significant increase from \$23.8 million for Q1 2025. This growth was driven by improved performance in its Heavy Fabrications and Industrial Solutions segments.
- Segment Performance:
-
Heavy Fabrications:
- Revenue: \$23.8M (Q1 2026) vs \$17.6M (Q1 2025)
- Adjusted EBITDA: \$1.7M (Q1 2026) vs \$3.4M (Q1 2025)
- Net Income: \$565,000 (Q1 2026) vs \$1.7M (Q1 2025)
-
Gearing Segment:
- Revenue: \$5.6M (Q1 2026) vs \$5.7M (Q1 2025)
- Adjusted EBITDA: \$558,000 (Q1 2026) vs \$(244,000) loss (Q1 2025)
- Net Loss: \$(113,000) (Q1 2026) vs \$(961,000) (Q1 2025)
-
Industrial Solutions Segment:
- Revenue: \$1.0M (Q1 2026) vs \$0.5M (Q1 2025)
- Adjusted EBITDA: \$1.77M (Q1 2026) vs \$491,000 (Q1 2025)
- Net Income: \$1.40M (Q1 2026) vs \$196,000 (Q1 2025)
-
Heavy Fabrications:
- Cash Position: The Company ended Q1 2026 with cash and cash equivalents of \$1.2 million, compared to \$1.7 million at the end of Q1 2025. The net increase in cash for the quarter was \$487,000, reflecting strong cash flow management despite the net loss.
- Shareholder Equity: Stockholders’ equity stood at \$66.2 million as of March 31, 2026, compared to \$66.3 million at December 31, 2025, reflecting a stable capital base.
- Balance Sheet Highlights:
- Current assets: \$64.3 million
- Current liabilities: \$28.4 million
- Long-term debt (excluding current maturities): \$4.8 million
- Treasury stock: 273,937 shares at a cost of \$1.84 million
Operational and Strategic Updates
- Sale of Abilene, Texas Facility: The Company highlighted the completion of its sale of the Abilene, Texas production facility, stating it will impact future results and cash flows. This transaction is part of Broadwind’s ongoing strategic realignment to optimize operational efficiency and capital allocation.
- Focus on Diversification: Management is prioritizing diversification of its customer base and sector focus, aiming to reduce dependency on a few large customers and leverage relationships across business units.
- Regulatory Environment: The report draws attention to ongoing federal, state, and local regulatory changes, including the future of tax incentives for renewable energy, tariffs on steel and other imports, and renewable portfolio standards, all of which can materially affect Broadwind’s results.
Price-Sensitive and Shareholder-Relevant Information
- Forward-Looking Statements and Risk Factors: The Company outlined several risks that could impact future results, including:
- The effect of the Abilene facility sale on ongoing financial results.
- Dependence on a limited number of customers and active efforts to diversify.
- Macroeconomic volatility, including commodity prices, market disruptions, and shifts in government policy.
- Ongoing competition from foreign manufacturers and potential for increased tariffs.
- Risk of losing tax benefits due to ownership changes, potential proxy contests, and activist investor actions.
- Impact of future stock issuances or conversions on share price volatility.
- These factors could result in material changes to the Company’s financial performance and stock price. Investors should pay close attention to these disclosures.
Non-GAAP Financial Measures
The Company continues to use and report Adjusted EBITDA as a key measure of operational performance. For Q1 2026, consolidated Adjusted EBITDA was \$3.9 million, compared to \$3.7 million in Q1 2025. Investors are reminded to review both GAAP and non-GAAP metrics for a complete understanding of performance.
Exhibits and Additional Information
- Exhibit 99.1: Contains the full press release with details on the Company’s quarterly results.
- Exhibit 99.2: Investor presentation including balance sheet, income statement, cash flow statement, and GAAP-to-Non-GAAP reconciliations.
Management Sign-Off
The report was signed by Eric B. Blashford, President and Chief Executive Officer, on May 12, 2026, reaffirming the accuracy and completeness of the disclosures.
Investor Takeaways
- Revenue Growth: The Company posted solid top-line growth, which is encouraging for investors seeking expansion and market share gains in the wind and industrial sectors.
- Profitability Challenges: The net loss, albeit narrowing compared to last year, underscores ongoing challenges with profitability, especially in the Heavy Fabrications segment.
- Cash Management: The positive cash flow and stable equity position demonstrate solid financial discipline, though the lower cash balance year-over-year warrants attention.
- Strategic Initiatives: The Abilene facility sale, customer diversification, and ongoing focus on operational efficiency are likely to be material to future performance and share value.
- Risk Factors: The Company’s detailed risk disclosures should be considered by all investors as they could impact earnings, cash flow, and ultimately the share price.
Disclaimer: This article is for informational purposes only and does not constitute investment advice. All forward-looking statements are subject to risks and uncertainties that may cause actual results to differ materially from those projected. Investors should perform their own due diligence before making investment decisions.