Quaker Chemical Corporation Q1 2026 Financial Report: Key Highlights and Shareholder Analysis
Overview
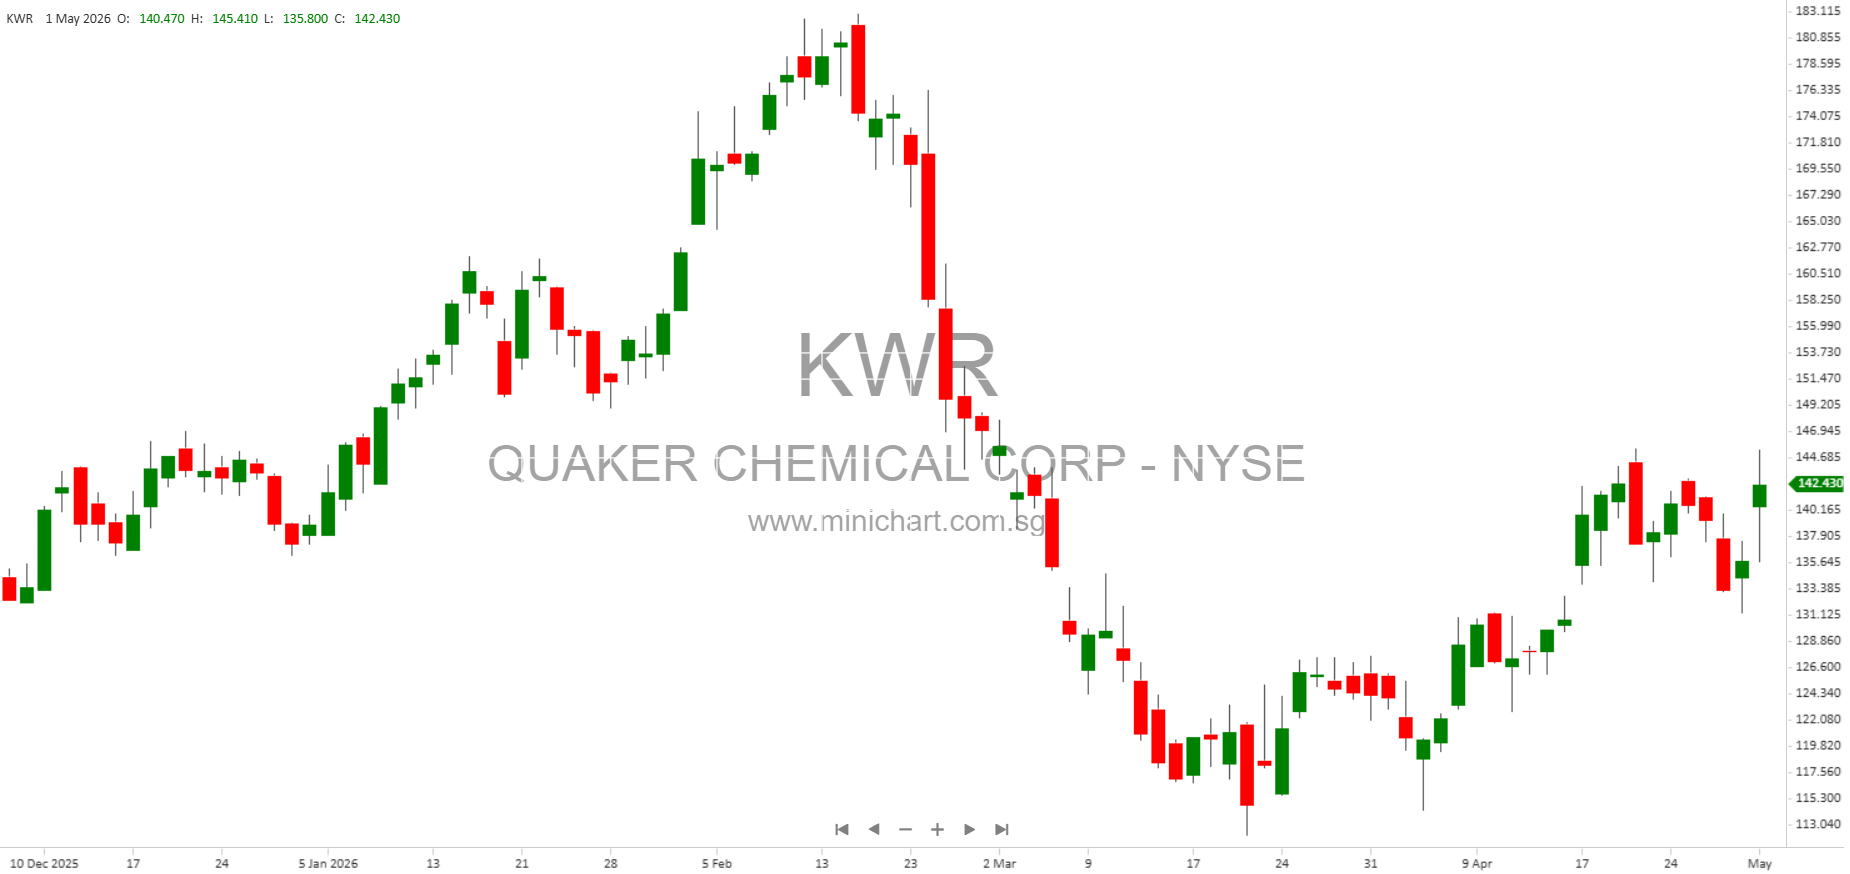
Quaker Chemical Corporation (NYSE: KWR), headquartered at One Quaker Park, Conshohocken, PA, has released its quarterly report for the period ended March 31, 2026. The company’s Common Stock (\$1 par value) remains listed on the New York Stock Exchange under the trading symbol “KWR”. As of April 27, 2026, there were 17,366,444 shares of common stock outstanding.
Key Financial Results
- Net Income: For Q1 2026, net income stood at \$19.74 million, a significant increase from \$12.92 million in Q1 2025.
- Earnings Per Share (EPS): Basic EPS was \$1.11 in Q1 2026, substantially higher than the \$0.73 reported in Q1 2025. Diluted EPS was \$1.13 versus \$0.73 in the prior year.
- Dividends: Dividends declared per share were \$0.508 in Q1 2026, compared to \$0.485 in Q1 2025.
- Comprehensive Income: Comprehensive income for Q1 2026 totaled \$9.97 million, compared to \$38.89 million in Q1 2025, indicating a decrease in other comprehensive income components.
- Shareholder Equity: As of March 31, 2026, total shareholders’ equity was \$1.375 billion, up from \$1.373 billion at year-end 2025.
Operational Highlights
- Restructuring and Related Charges: The company incurred \$7.38 million in restructuring and related charges during Q1 2026. This is a notable item and may signal ongoing operational changes, which could affect future profitability.
- Income Before Taxes: Income before taxes and equity in net income of associated companies was \$23.69 million for Q1 2026, up from \$12.92 million in Q1 2025.
- Interest Expense: Net interest expense for the quarter was \$9.55 million, higher than previous periods, which may reflect changes in debt structure or increased borrowing costs.
- Cash and Cash Equivalents: As of March 31, 2026, cash and cash equivalents were \$169 million, up from \$137 million at year-end 2025, indicating improved liquidity.
- Intangible Assets: Intangible assets net of goodwill stood at \$848 million, compared to \$874 million at year-end 2025, suggesting ongoing amortization.
- Investments in Associated Companies: Investments totaled \$106 million, largely unchanged from year-end 2025.
- Total Assets: Total assets at the end of the quarter were \$2.80 billion, up slightly from \$2.80 billion at year-end 2025.
Cash Flow Analysis
- Operating Activities: Net income contributed \$19.74 million to operating cash flows.
- Depreciation and Amortization: The company recorded \$20.6 million in depreciation and amortization.
- Investing Activities: \$13.4 million used in investing activities, primarily for property, plant, and equipment. No significant proceeds from asset sales.
- Financing Activities: Dividend payments totaled \$8.8 million; share issuance and equity-based compensation plans provided \$2 million.
Capital Structure and Shareholder Information
- Common Stock: 17,365,508 shares issued and outstanding as of March 31, 2026.
- Authorized Shares: 30,000,000 shares authorized.
- Capital in Excess of Par Value: \$466 million.
- Accumulated Other Comprehensive Income/Loss: (\$125 million) as of March 31, 2026, compared to (\$115 million) at year-end 2025.
- Noncontrolling Interest: \$3.39 million.
Price Sensitive and Shareholder-Relevant Items
- Restructuring Charges: The \$7.38 million restructuring charge is significant. It may indicate ongoing efforts to streamline operations, cut costs, or reposition the company, potentially impacting future margins and profitability.
- Substantial Increase in Net Income and EPS: The jump in net income and EPS compared to the prior year quarter is likely to attract positive investor attention.
- Dividend Increase: The increase in dividend per share may signal management’s confidence in cash flow and profitability, which is generally viewed favorably by shareholders.
- Liquidity Improvement: The rise in cash and cash equivalents strengthens the company’s financial position and reduces risk, potentially supporting share price.
- Interest Expense Rise: The increase in net interest expense could be a concern if it reflects higher borrowing costs or increased debt levels.
- Comprehensive Income Drop: The marked decrease in comprehensive income compared to Q1 2025 may warrant caution, as it could reflect negative currency or market effects.
Summary for Investors
Quaker Chemical Corporation’s Q1 2026 report shows strong growth in net income and earnings per share, a higher dividend, and improved liquidity. However, the company is undergoing restructuring, incurring significant charges that may impact future results. The rise in interest expense should be monitored. The overall increase in shareholder equity, alongside operational improvements, is positive, but the decrease in comprehensive income may moderate enthusiasm. Shareholders should watch for further details on restructuring outcomes and any updates to interest and debt management.
Disclaimer
This article is for informational purposes only and does not constitute investment advice. Investors should review the full financial report and consult with their financial advisor before making investment decisions. All figures are based on the unaudited condensed consolidated financial statements as reported by Quaker Chemical Corporation for the quarter ended March 31, 2026.