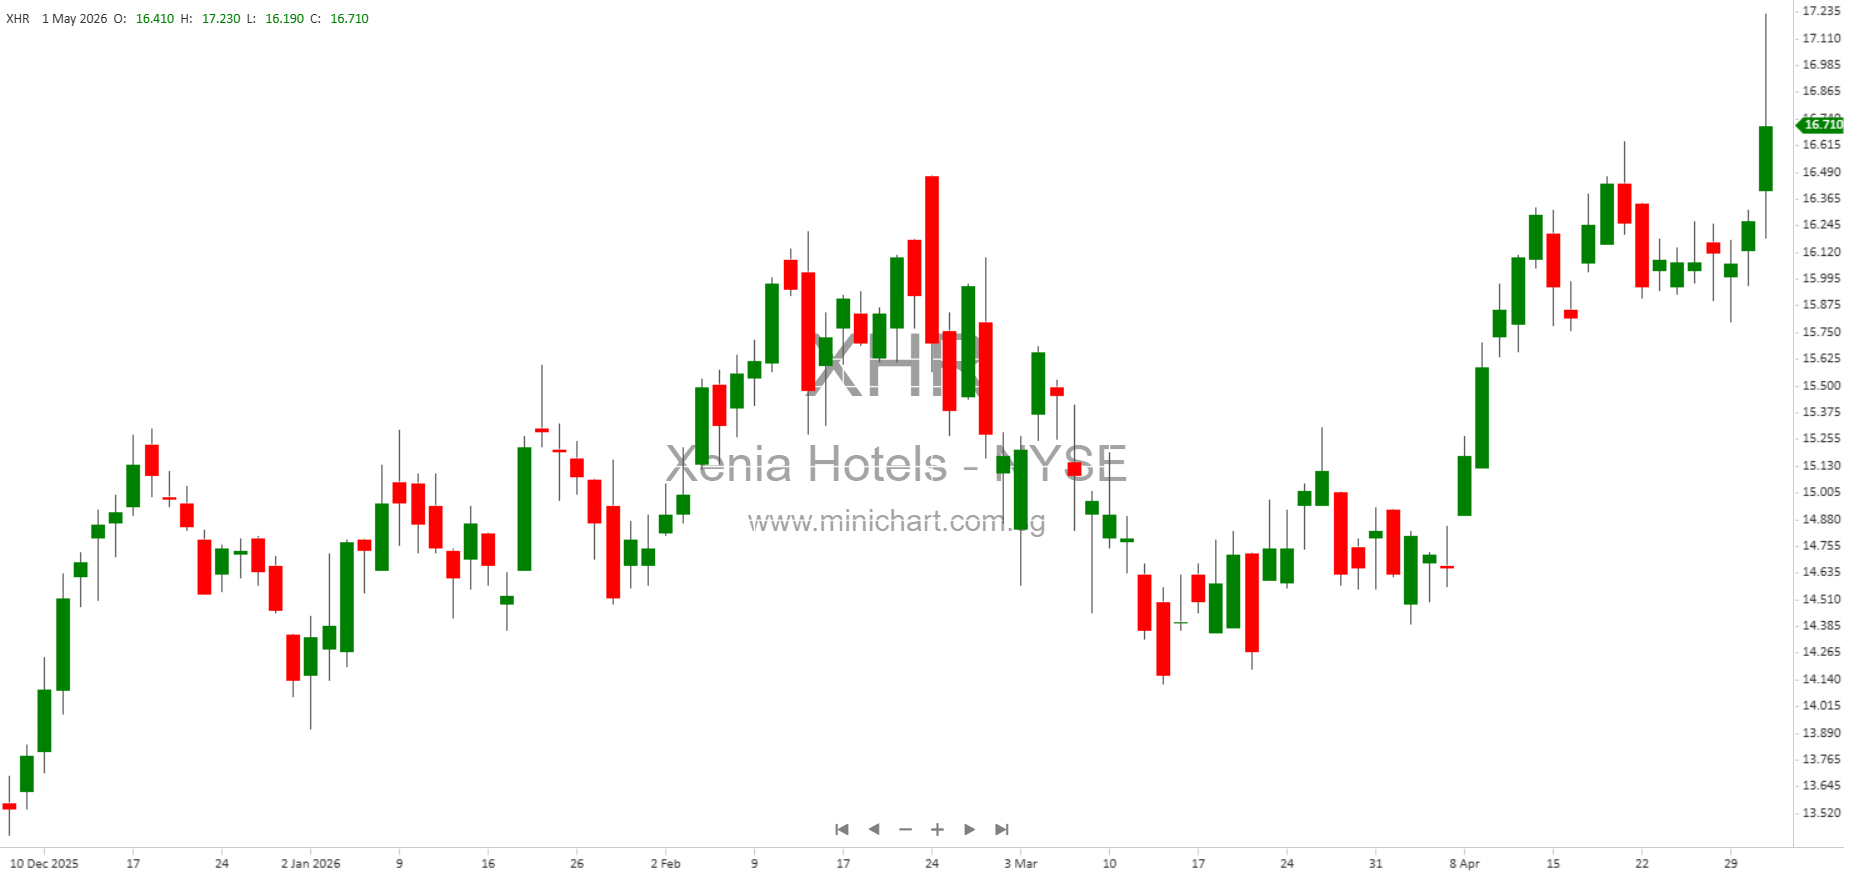
Xenia Hotels & Resorts Reports Strong Q1 2026 Results and Raises Full-Year Guidance
Key Highlights from Q1 2026 Results
- Net Income: \$19.8 million attributable to common stockholders, up 26.9% year-over-year, or \$0.21 per share (a 40% increase).
- Adjusted EBITDAre: \$81.4 million, an 11.6% increase over Q1 2025.
- Adjusted FFO per Diluted Share: \$0.63, up 23.5% year-over-year.
- Same-Property Occupancy: 71.4%, a 180 basis point increase.
- Same-Property Average Daily Rate (ADR): \$288.62, up 4.8%.
- Same-Property RevPAR: \$205.93, up 7.4%.
- Same-Property Hotel EBITDA: \$87.8 million, up 17.9%.
- Same-Property Hotel EBITDA Margin: 29.7%, representing a 270 basis point improvement.
- Dividend: Declared \$0.14 per share for Q1 2026.
- Debt Management: Paid off \$52 million mortgage on Grand Bohemian Hotel Orlando, and paid down \$6.3 million on Andaz Napa mortgage.
Management Commentary and Outlook
Marcel Verbaas, Chair and CEO, commented on the Q1 outperformance, highlighting record results at the Grand Hyatt Scottsdale Resort and robust demand across the portfolio. The Company saw exceptional March performance, with over 14% growth in Same-Property RevPAR compared to March 2025. Verbaas emphasized that this growth was driven by higher ADR and disciplined expense management, leading to substantial margin improvement.
Due to the outperformance, Xenia has raised its full-year 2026 guidance. Management also noted that momentum continued into April, with estimated Same-Property RevPAR growth of nearly 6% year-over-year. The group booking pace remains solid, and management sees the well-positioned luxury and upper-upscale lodging portfolio and healthy balance sheet as a foundation for further growth in 2026 and beyond.
Updated Full-Year 2026 Guidance
| Metric | Current Guidance (Low-High) | Prior Guidance (Low-High) | Change at Midpoint |
|---|---|---|---|
| Net Income (\$ millions) | \$24 – \$40 | \$21 – \$41 | +\$1M |
| Same-Property RevPAR Change | +2.75% to +5.25% | +1.50% to +4.50% | +1.00% |
| Same-Property Total RevPAR Change | +3.75% to +6.25% | +2.75% to +5.75% | +0.75% |
| Adjusted EBITDAre (\$ millions) | \$258 – \$274 | \$250 – \$270 | +\$6M |
| Adjusted FFO (\$ millions) | \$178 – \$190 | \$170 – \$190 | +\$6M |
| Adjusted FFO per Diluted Share | \$1.86 – \$2.02 | \$1.78 – \$1.99 | +\$0.06 |
| Capital Expenditures (\$ millions) | \$70 – \$80 | \$70 – \$80 | — |
- Guidance assumes ongoing renovation disruption will negatively impact Adjusted EBITDAre and Adjusted FFO by ~\$1 million.
- General and administrative expenses expected to be ~\$25 million (up \$1 million from prior).
- Interest expense forecast at ~\$78 million.
- Weighted-average diluted shares/units: 95.7 million.
Liquidity, Balance Sheet, and Capital Allocation
- Total Debt: ~\$1.4 billion at a weighted-average interest rate of 5.53%.
- Cash and Equivalents: \$101 million as of March 31, 2026, plus \$78 million of restricted cash and escrows.
- Liquidity: \$601 million (cash plus full undrawn revolver).
- Unencumbered Properties: 28 out of 30 hotels are unencumbered.
- Share Repurchases: No share repurchases in Q1; \$97.5 million remains under authorization. No ATM issuance; \$300 million remains available.
Capital Expenditures and Renovations
- Q1 Investment: \$15.2 million in portfolio improvements.
- Completed Projects:
- Guestroom renovation at Fairmont Pittsburgh.
- M Club renovation at Marriott Dallas Downtown.
- Food & beverage overhaul at W Nashville, including new concepts by José Andrés Group: Zaytinya, Bar Mar, Butterfly (rooftop), and Glowbird (pool deck, opened late April).
- Upcoming 2026 Renovations:
- Andaz Napa: Guestrooms and corridors (Q4 start).
- The Ritz-Carlton, Denver: Guestrooms, corridors, and meeting spaces (Q4 start).
Portfolio Overview and Market Exposure
- Xenia owns 30 hotels and resorts with 8,868 rooms across 14 states, focused on top 25 lodging markets and key leisure destinations.
- Major operators include Marriott, Hyatt, Kimpton, Fairmont, Loews, Hilton, and Davidson.
- Largest markets by 2025 Hotel EBITDA: Orlando (17%), Houston (14%), Phoenix (11%), San Diego (8%), Atlanta (8%).
Q1 2026 Detailed Operating Metrics
- Portfolio Occupancy: 71.4% (vs. 69.6% in Q1 2025).
- ADR: \$288.62 (up 4.8%).
- RevPAR: \$205.93 (up 7.4%).
- Total RevPAR: \$370.13 (up 7.2%).
- Hotel EBITDA Margin: 29.7% (up 270 bps).
- Key Markets Showing Strength: Orlando, Houston, Phoenix, and others all posted strong RevPAR and ADR growth.
Potentially Price-Sensitive Items for Shareholders
- Raised 2026 guidance across all key metrics following a significant Q1 beat and ongoing strong booking trends.
- Substantial margin improvement and higher per-share earnings point to enhanced profitability and operational leverage.
- Strong liquidity and balance sheet support continued investment, debt repayment, and potential for future return of capital.
- No share repurchases or ATM issuance in Q1, preserving financial flexibility.
- Ongoing and upcoming renovations could both temporarily impact earnings and drive future growth and asset values.
Upcoming Events
Xenia will host its Q1 2026 earnings conference call on Friday, May 1, 2026, at 1:00 PM ET. Investors can participate by dialing (833) 470-1428, access code 982356, or via a webcast at www.xeniareit.com.
Conclusion
Xenia Hotels & Resorts delivered a robust Q1 2026, outperforming expectations and raising full-year guidance across all critical performance, profitability, and cash flow metrics. The company’s strong operational execution, disciplined expense management, and well-timed renovations position it for continued outperformance. These developments are likely to be viewed positively by investors and may influence XHR’s share valuation in the near term.
Disclaimer: This article is for informational purposes only and does not constitute investment advice. Investors should review Xenia Hotels & Resorts’ full filings and consult their own financial advisors before making investment decisions. Forward-looking statements involve risks and uncertainties that could cause actual results to differ materially.