OneMain Holdings, Inc. Delivers Robust First Quarter 2026 Financial Results
Key Highlights for Investors
- Diluted EPS: \$1.93 (GAAP), up from \$1.78 in Q1 2025
- Adjusted Diluted EPS (C&I): \$1.95, up from \$1.72 in Q1 2025
- Net Income: \$226 million, up from \$213 million in Q1 2025
- Pretax Income: \$296 million, up from \$275 million in Q1 2025
- Quarterly Dividend: \$1.05 per share declared
- Share Repurchases: 1.9 million shares repurchased for \$105 million
- Managed Receivables: \$26.1 billion, up 6% year-over-year
- Consumer Loan Originations: \$3.1 billion, up 3% year-over-year
- Total Revenue: \$1.6 billion, up 6% year-over-year
- Net Interest Income: \$1.065 billion
- Return on Assets: 3.4%
- Book Value per Share: \$29.21
Detailed Financial and Operational Performance
Strong Start to 2026
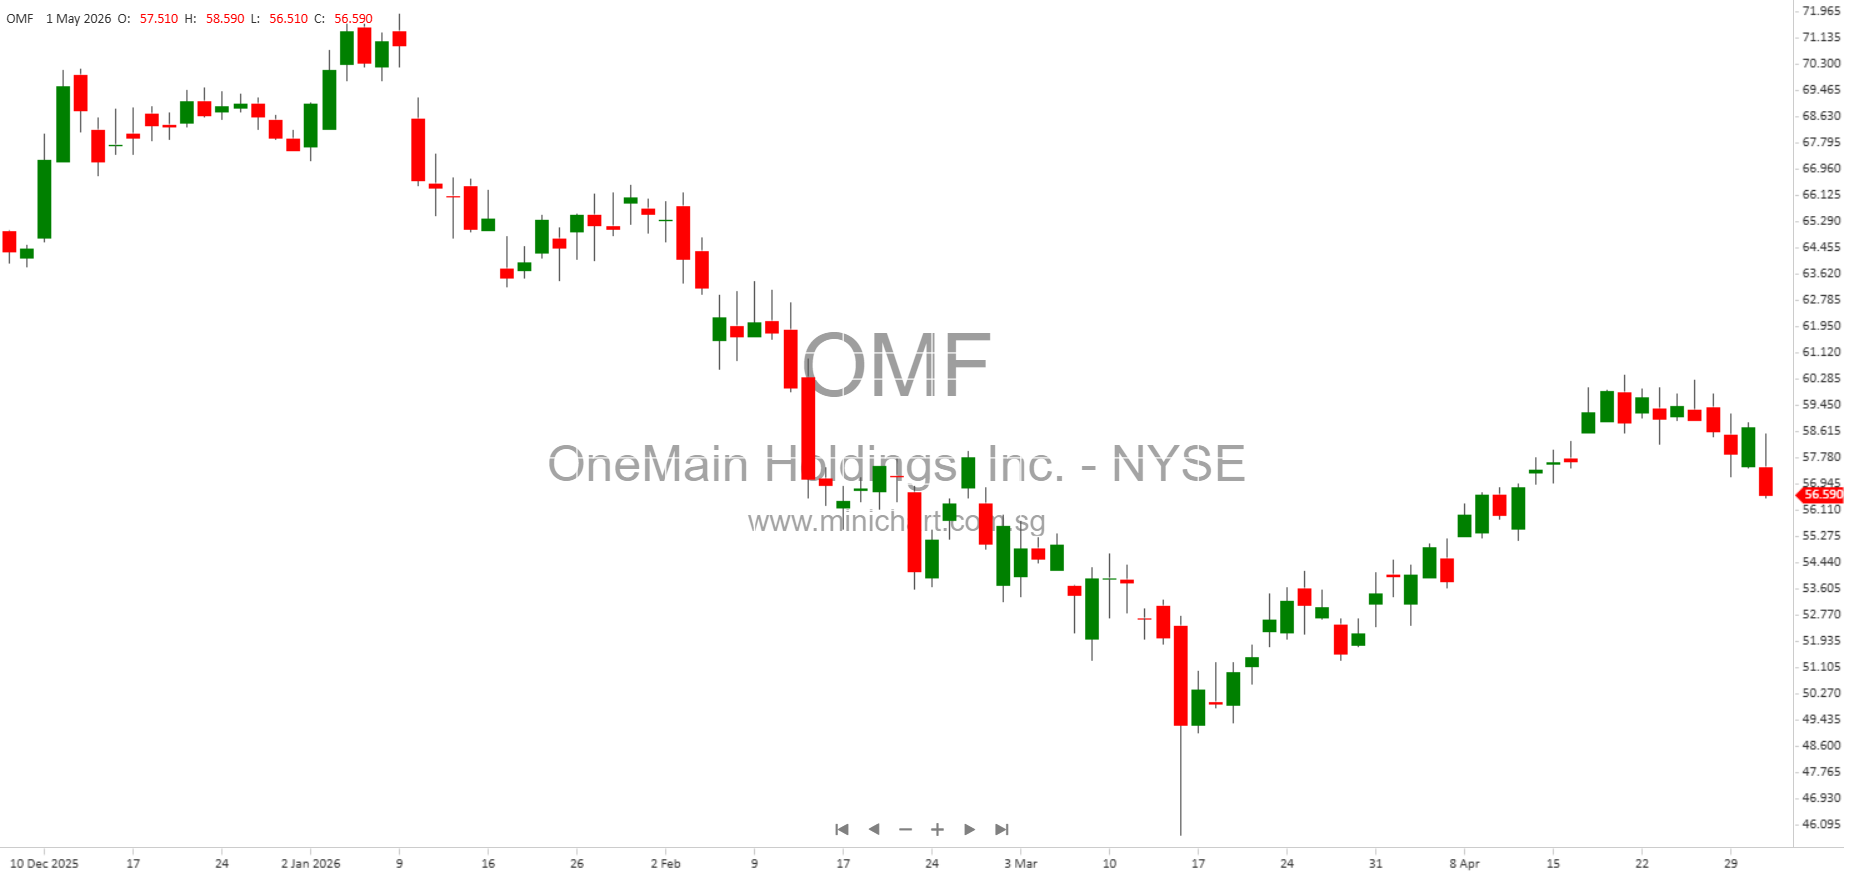
OneMain Holdings, Inc. (NYSE: OMF), a leader in providing responsible credit access to nonprime consumers, reported strong results for the first quarter of 2026. The company’s disciplined approach to credit, robust balance sheet management, and execution of growth initiatives have driven improved profitability and revenue growth.
Dividend and Shareholder Return
The Board of Directors declared a quarterly dividend of \$1.05 per share, payable May 15, 2026, to shareholders of record as of May 11, 2026. Additionally, OneMain repurchased approximately 1.9 million shares of common stock for \$105 million during the quarter—a clear sign of confidence in the business and commitment to shareholder returns.
Segment Performance: Consumer & Insurance (C&I)
- Adjusted pretax income: \$305 million (up from \$275 million in Q1 2025)
- Adjusted net income: \$229 million (up from \$207 million in Q1 2025)
- Capital generation: \$194 million, stable year-over-year
- Adjusted diluted EPS: \$1.95 (up from \$1.72 in Q1 2025)
- Managed receivables: \$26.1 billion, up 6% year-over-year
- Allowance for finance receivable losses: \$2.82 billion (11.53% of net receivables)
- Net charge-off ratio: 8.02% (up from 7.83% in Q1 2025)
- Delinquency ratios (30+ days): 5.37% (up from 5.16% in Q1 2025, but down from 5.85% in Q4 2025)
- Consumer loan originations: \$3.1 billion, up 3% year-over-year
- Yield on consumer loans remains robust at 22.5%
Income Statement and Balance Sheet Insights
- Net interest income: \$1.065 billion, up from \$996 million in Q1 2025
- Interest expense: \$322 million, up 4% year-over-year (reflecting growth in average debt to support receivables growth)
- Provision for finance receivable losses: \$465 million, up \$9 million year-over-year
- Operating expenses: \$437 million, up 9% year-over-year, reflecting both receivable growth and strategic business investments
- Total assets: \$27.0 billion
- Long-term debt: \$22.4 billion (51% secured)
- Shareholders’ equity: \$3.38 billion
- Book value per basic share: \$29.21 (up from \$27.50 in Q1 2025)
Funding and Liquidity Position
- Cash and cash equivalents: \$834 million (with \$155 million not available for general corporate purposes)
- Undrawn committed capacity: \$1.1 billion from corporate revolver, \$6.4 billion from conduits and credit card funding notes
- Unencumbered receivables: \$11.4 billion
- Net leverage ratio: 5.4x (net adjusted debt to adjusted capital)
- Liquidity remains strong, with significant resources to meet obligations and support growth
Key Metrics and Credit Quality Trends
| Metric | Mar 31, 2026 | Mar 31, 2025 |
|---|---|---|
| 30+ days delinquency ratio | 5.37% | 5.16% |
| 90+ days delinquency ratio | 2.53% | 2.38% |
| Net charge-off ratio | 8.02% | 7.83% |
| Allowance ratio | 11.53% | 11.52% |
| Yield (consumer loans) | 22.5% | 22.4% |
Note: While delinquency and charge-off ratios are slightly elevated year-over-year, they remain within expected ranges and are offset by strong capital and reserves.
Management Commentary
“We delivered a very good start to 2026, executing on our growth initiatives while maintaining our disciplined credit approach and balance sheet management. As we execute across our core loan business and newer products, we are driving revenue growth with good credit performance, reinforcing our ability to generate sustainable, attractive returns for shareholders.”
— Doug Shulman, Chairman and CEO
Outlook and Shareholder Considerations
- The continued growth in receivables and originations signals positive momentum and potential for further earnings growth.
- The maintenance of strong liquidity and capital positions the company well to weather economic volatility and invest in strategic initiatives.
- The robust dividend and active share repurchase program highlight management’s commitment to shareholder value and may support the share price.
- Potential risks include economic downturns, increased delinquencies, regulatory changes, and interest rate fluctuations, all of which are being closely monitored by management.
Conference Call Details
OneMain management will host a conference call and webcast to discuss results, outlook, and related matters at 9:00 am ET on Friday, May 1, 2026. Investors can access the call via phone or webcast through the company’s investor relations website.
Conclusion
OneMain Holdings, Inc. delivered a strong Q1 2026, with growth in core financial metrics, continued strategic investments, and robust capital return to shareholders. While credit quality indicators remain an area to watch, the company’s strong reserves, liquidity, and earnings momentum support a positive outlook for investors.
Disclaimer: This article is for informational purposes only and does not constitute investment advice. Investors should conduct their own research and consider their own risk tolerance before making investment decisions. The information herein is based on publicly available data as of the reporting date and may be subject to change without notice.