Equinix, Inc. Q1 2026 Financial Report: Key Highlights for Investors
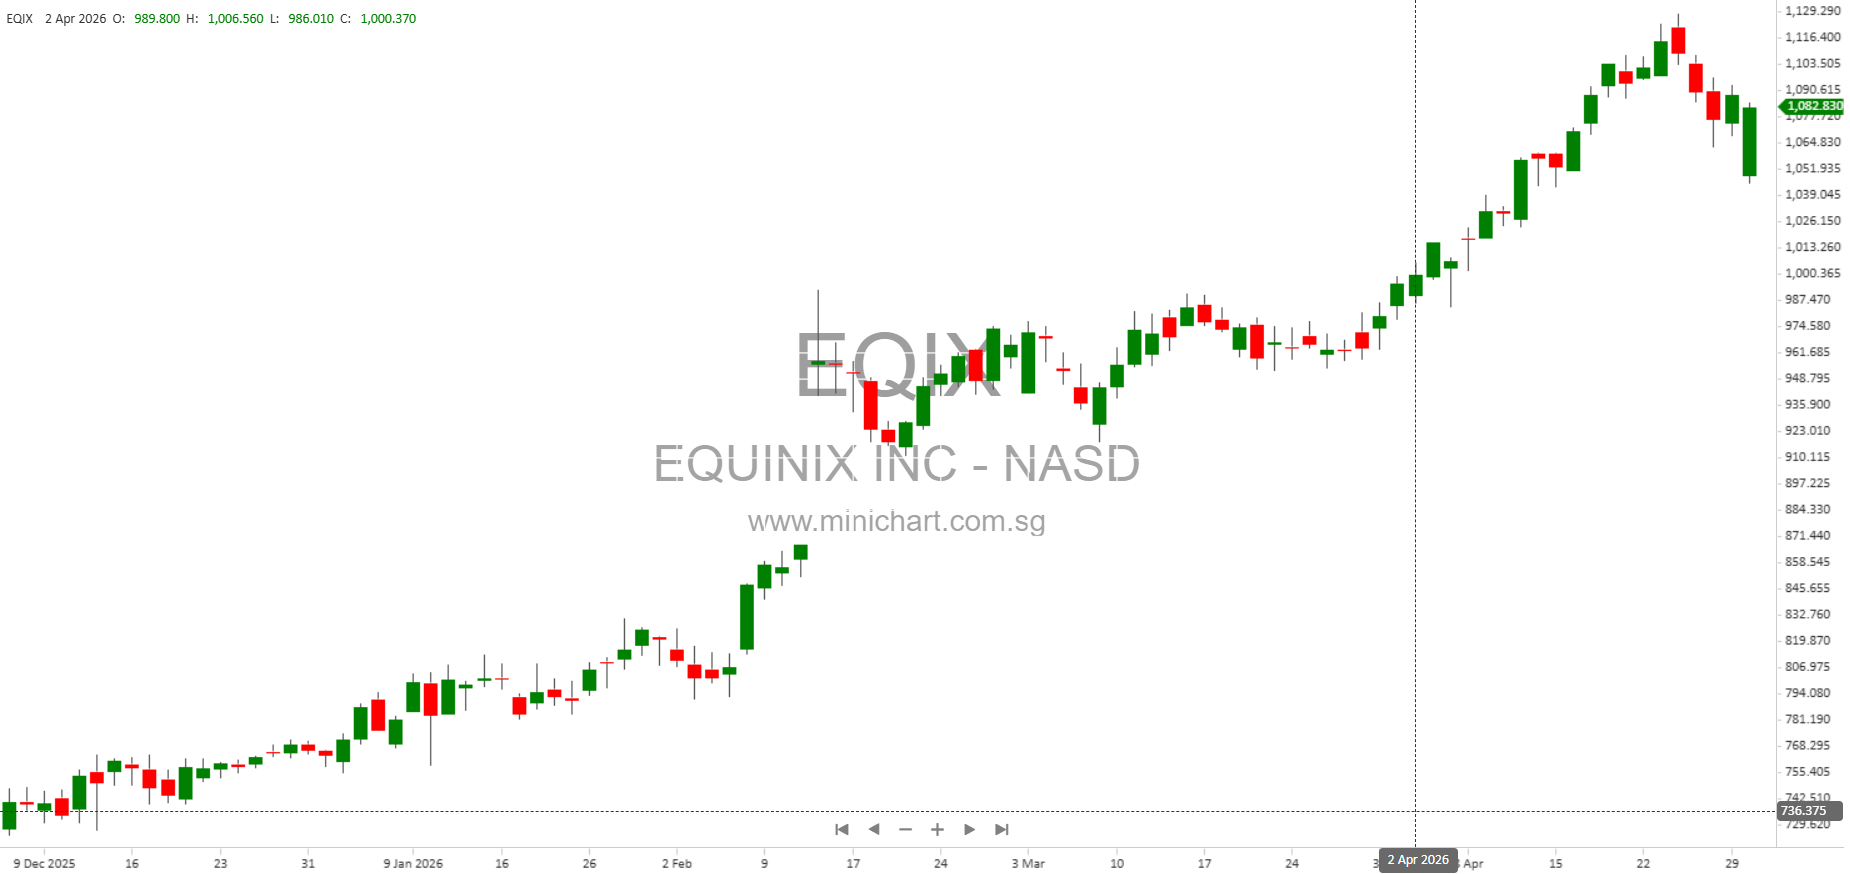
Equinix, Inc. (Nasdaq: EQIX), a leading global provider of digital infrastructure, has released its financial results for the first quarter ended March 31, 2026. The quarterly report provides several important insights into the company’s operational and financial performance, as well as the risks and opportunities facing the business. Below, we present a detailed breakdown of the key points that investors and shareholders need to know.
Key Financial Highlights
-
Strong Balance Sheet:
- Total assets reached \$40.9 billion as of March 31, 2026, up from \$40.1 billion at the end of 2025, highlighting ongoing asset growth.
- Cash and cash equivalents stood at \$1.73 billion, providing significant liquidity for operations and expansion.
- Short-term investments were \$1.69 billion.
- Intangible assets, net, were reported at \$1.26 billion, with other noncurrent assets at \$2.74 billion.
-
Liabilities and Equity:
- Total liabilities and stockholders’ equity matched the asset base at \$40.9 billion.
- Senior notes (debt): Current portion at \$1.88 billion and long-term portion at \$17.7 billion, indicating a substantial debt load that could impact future flexibility.
- Redeemable non-controlling interest was \$25 million.
- Common stockholders’ equity increased to \$14.3 billion.
- 98.6 million shares outstanding as of March 31, 2026.
-
Profitability:
- Net income attributable to common stockholders for Q1 2026 was \$415 million, a notable increase from \$343 million in Q1 2025.
- Operating income for the quarter was \$577 million, up from \$458 million in the prior-year period.
- Interest income increased to \$41 million, versus \$47 million in the prior year, reflecting changes in the investment portfolio or interest rates.
Risks and Factors Affecting Shareholder Value
-
Risks Related to the Macro Environment:
- Geopolitical events and political tensions continue to present risks and challenges that may adversely impact business operations and results.
-
Business and Offering Risks:
- Long sales cycles could impact revenue growth and operational results.
- Intense competition from current and future players may put pressure on market share and pricing.
- The inability to develop, acquire, or enhance offerings could harm competitive differentiation and financial performance.
- Government contracts introduce revenue concentration risk and the potential for early termination, audits, investigations, and penalties.
- Customer concentration risk: Failure to attract, grow, and retain key customers (including ‘magnet’ customers) could materially harm the business.
-
Financial and Market Risks:
- The market price of Equinix stock has been highly volatile and may continue to be so, potentially impacting shareholder value.
- The company may in the future face securities class action or other litigation, which could negatively affect results.
- Results of operations may fluctuate quarter-to-quarter.
- Substantial past and potential future losses, as well as possible impairment charges to goodwill, intangible assets, or property, plant, and equipment, could significantly reduce earnings.
-
International and Expansion Risks:
- Challenges in managing and expanding international operations may adversely impact growth plans.
- Insufficient customer demand for new expansion projects could limit returns on investment.
-
Capital and Sustainability Risks:
- High debt levels (\$17.7 billion in long-term debt) may affect the company’s ability to raise additional capital and manage cash flows.
- Sales or issuances of common stock could dilute existing shareholders and negatively affect the share price.
- Inability to generate sufficient operating cash flows or raise external financing may constrain future expansion.
- Environmental and sustainability legislation may introduce new or unexpected costs, and physical risks related to climate change may adversely affect operations.
- Failure to achieve sustainability targets could damage public perception and stakeholder relationships.
-
Regulatory and REIT Status Risks:
- Changes in U.S. or international tax laws or regulations could directly impact Equinix’s financial statements and cash tax obligations.
- Failure to maintain REIT (real estate investment trust) status for federal tax purposes could expose the company to significant corporate income taxes and have a material adverse effect on financial results.
Other Notable Factors
-
Shareholder Information:
- The number of shares of common stock outstanding as of April 28, 2026 was 98,624,248.
- Equinix remains a large accelerated filer and is not an emerging growth company or shell company.
-
SEC Reporting Compliance:
- Equinix has filed all required reports and submitted all Interactive Data Files for the preceding 12 months, in compliance with SEC requirements.
Conclusion and Potential Impact on Share Price
The Q1 2026 report demonstrates Equinix’s continued financial strength and growing profitability, supported by a healthy cash position and equity base. However, the company faces significant challenges, including a high level of debt, exposure to macroeconomic and regulatory risks, competitive pressure, and the need for successful international expansion. The volatility of the company’s stock price, potential for future losses, and risks related to its REIT status and sustainability initiatives are all factors that could materially affect shareholder value.
Investors should closely monitor developments in these risk areas, as well as the company’s ability to execute on its growth and sustainability strategies. Any negative surprises in these domains could result in significant share price movements.
Disclaimer: This article is for informational purposes only and does not constitute investment advice. Investors should review the full SEC filings and consult with their financial advisors before making any investment decisions. The information is based on the most recent quarterly filing as of March 31, 2026, and may not reflect subsequent events or market developments.