T. Rowe Price Group Reports Q1 2026 Results: Key Points for Investors
Overview
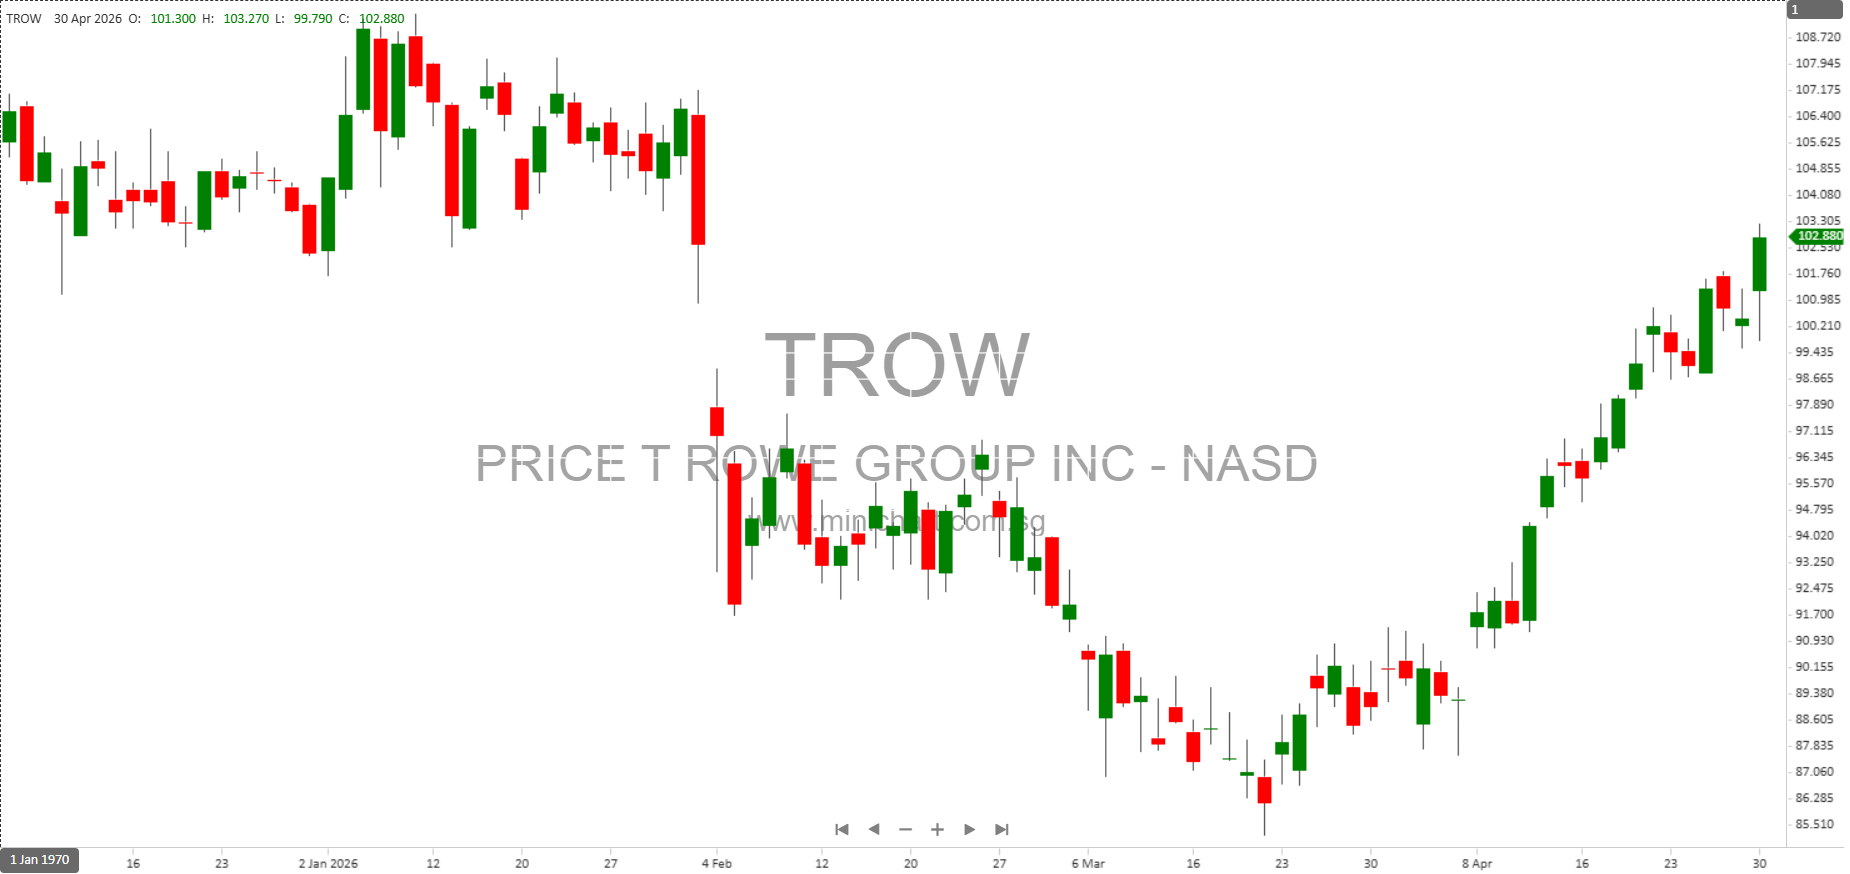
T. Rowe Price Group, Inc. (NASDAQ: TROW) has released its financial results for the first quarter of 2026, providing investors with a comprehensive view of the company’s performance amidst ongoing market volatility. The announcement highlights several important financial metrics, strategic commentary from management, and developments relevant to shareholders.
Key Financial Highlights
- Assets Under Management (AUM): \$1.71 trillion as of March 31, 2026. Approximately two-thirds of these assets are retirement-related, underscoring the firm’s strong positioning in the retirement investment space.
- Net Client Outflows: \$13.7 billion for the quarter, indicating a continued challenge in attracting or retaining client assets.
- Net Revenues: \$1.86 billion for Q1 2026, reflecting the company’s ability to maintain strong topline performance despite industry headwinds.
- Net Income (GAAP): \$498.2 million, compared to \$490.3 million in Q1 2025.
- Diluted Earnings Per Common Share (GAAP): \$2.23 per share, up from \$2.19 in the prior-year quarter.
- Adjusted Diluted EPS: \$2.52, compared to \$2.23 in the previous year.
- Returned Capital: \$629 million was returned to shareholders via recurring quarterly dividends and stock repurchases.
Segment and Fee Details
- Investment Advisory Fees: \$1.68 billion, reflecting a stable fee income base despite the net outflows.
- Performance-Based Advisory Fees: \$7.5 million, down from \$10.4 million in Q1 2025, indicating less robust outperformance in products with performance fees.
- Capital Allocation-Based Income: \$28.1 million, reflecting carried interest accruals.
- Effective Fee Rate: The investment advisory annualized effective fee rate was 38.4 basis points, down from 40.0 bps in Q1 2025, demonstrating continued industry fee compression.
- Adjusted Effective Fee Rate (incl. performance fees): 38.6 bps vs. 40.3 bps in Q1 2025.
Business Commentary and Strategic Position
Rob Sharps, Chair, CEO, and President:
“With the recent volatility and broadening of markets, our active management approach positions us to take advantage of the opportunities this climate brings. Our teams are advancing innovative strategies, new vehicles, and compelling solutions to meet the evolving needs of clients.”
The firm reiterated its commitment to active management and innovation in response to market volatility and evolving client needs. Management highlighted progress in developing new investment vehicles and solutions, as well as ongoing investment in proprietary research and technology.
Cash Flows and AUM Movement
- Net Cash Flows (excluding manager-driven distributions): Outflow of \$22.6 billion, partially offset by market appreciation and income.
- Net Cash Flows (after manager-driven distributions): Total net outflows for the quarter were \$13.7 billion.
- Market Appreciation/Depreciation and Income: Negative impact of \$45.4 billion on AUM, indicating market headwinds.
Expense and Profitability Metrics
- Total Adjusted Operating Expenses: Expenses remain tightly managed, though the report notes certain increases due to investments in business growth and regulatory compliance.
- Non-Operating Income (Loss): Loss of \$48.3 million vs. gain of \$142.1 million in Q1 2025, driven by lower market returns and negative mark-to-market activity in the discretionary investment portfolio.
Taxation
- Effective Income Tax Rate (GAAP): 24.3% for Q1 2026, down from the prior-year period mainly due to lower state taxes and the reversal of certain deferred tax asset valuation allowances.
- Adjusted Effective Income Tax Rate: Also decreased vs. Q1 2025.
Shareholder Returns
- Dividends & Stock Repurchases: The company returned \$629 million to shareholders in the quarter, a significant commitment to returning capital and supporting the share price.
Additional Notable Developments
-
Webcast and Management Update:
Management, including CEO Rob Sharps and CFO Jen Dardis, will host a webcast on April 30, 2026, 8:00-8:45 AM ET. Glenn August (OHA CEO) and Eric Veiel (Head of Global Investments) will also participate, providing further insights into the alternatives business and investment performance. -
Alternatives Asset Class:
The firm’s alternatives category includes significant exposure to private credit, leveraged loans, real assets, and other non-public market strategies, with unfunded capital commitments of \$20.9 billion as of March 31, 2026. -
Forward-Looking Statements:
The report includes forward-looking commentary on anticipated changes in revenues, expenses, earnings, AUM, liquidity, regulatory developments, and effective fee rates.
Potential Price-Sensitive Issues for Shareholders
- Net Outflows: The persistence of net client outflows (\$13.7 billion) may be a concern for investors, as it reflects competitive and market challenges despite the firm’s strong brand and investment performance.
- Fee Rate Compression: The continued decline in effective fee rates (from 40.0 to 38.4 bps) could impact long-term profitability, especially if industry-wide price competition remains intense.
- Non-Operating Losses: The significant swing from a non-operating gain in Q1 2025 to a loss in Q1 2026 (-\$48.3 million) may signal increased market volatility and investment risk within the firm’s discretionary portfolios.
- Market Headwinds: Negative market returns impacting AUM and the investment portfolio could weigh on future revenue and earnings if persistent.
- Commitment to Shareholder Returns: Despite these headwinds, the company’s continued strong commitment to dividends and buybacks (\$629 million returned) may help support the stock price.
About T. Rowe Price
T. Rowe Price is a leading global asset manager with over 85 years of investment experience, managing \$1.71 trillion in assets as of March 31, 2026. The firm is recognized for its retirement leadership and proprietary research, serving millions of investors worldwide.
For further information or to access the webcast and supplemental materials, visit investors.troweprice.com.
Contact Information
- Public Relations: Lauren Dear, 410-577-5009, [email protected]
- Investor Relations: Linsley Carruth, 410-345-3717, [email protected]
Disclaimer: This article is based on the company’s official earnings release and associated exhibits. All financial data is unaudited and subject to change. Forward-looking statements are inherently uncertain and actual results may differ materially. This article is for informational purposes only and does not constitute investment advice. Investors should review the company’s full regulatory filings and consult their own advisers before making investment decisions.