Graham Holdings Company Q1 2026 Earnings Report: Key Highlights and Investor Takeaways
Overview
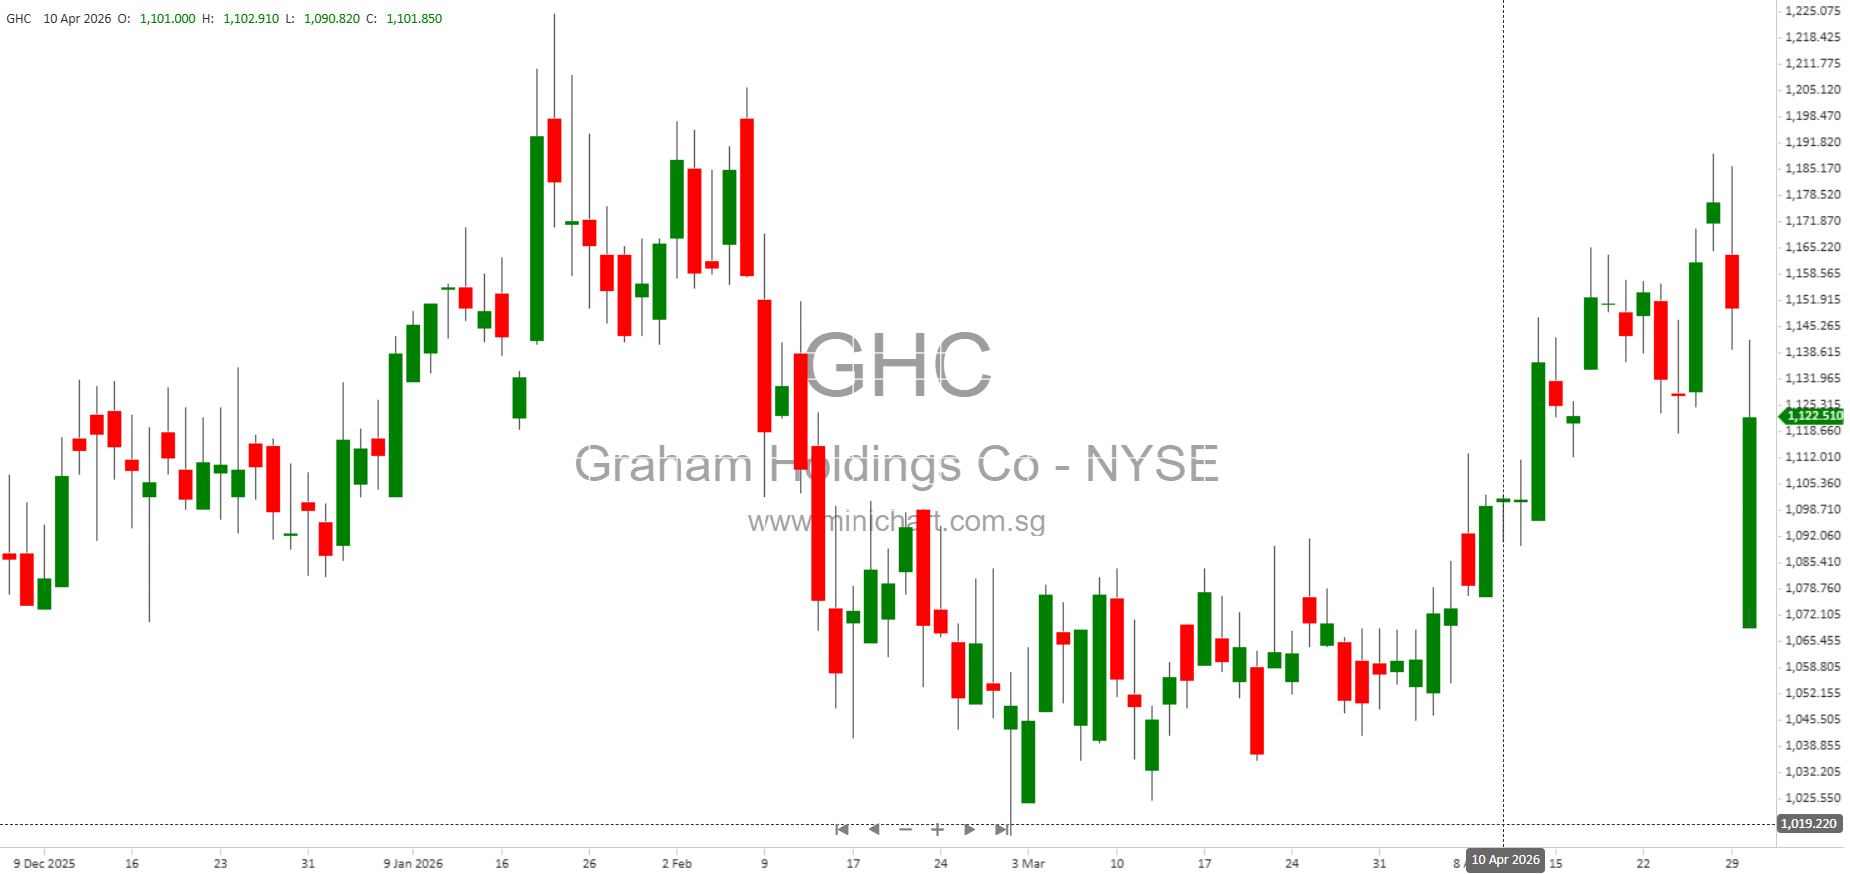
Graham Holdings Company (NYSE: GHC) has released its Quarterly Report (Form 10-Q) for the period ended March 31, 2026. The report details the company’s financial performance, key business segment results, and provides essential insights for shareholders and potential investors.
Key Financial Highlights
- Net Income: The company reported net income attributable to Graham Holdings of \$29.1 million for Q1 2026, up from \$23.9 million in Q1 2025, representing a notable increase in profitability.
- Earnings Per Share (EPS):
- Basic EPS: \$6.68 (Q1 2026) vs. \$5.50 (Q1 2025)
- Diluted EPS: \$6.62 (Q1 2026) vs. \$5.45 (Q1 2025)
- Operating Income: Operating income for the quarter was \$57.8 million, up from \$47.5 million in the prior year’s first quarter.
- Income Before Taxes: Income before income taxes stood at \$40.7 million, compared to \$30.8 million in the prior year.
- Comprehensive Income: Comprehensive income attributable to Graham Holdings was \$22.8 million in Q1 2026, while the prior year’s figure was \$37.0 million. The decrease was primarily due to larger foreign currency translation losses and other comprehensive income impacts.
Segment Performance and Noteworthy Items
- Equity in Earnings of Affiliates: The company posted a significant gain from equity method investments of \$34.9 million in Q1 2026, compared to a loss of \$8.4 million in Q1 2025. This is a substantial turnaround and may reflect improved performance in the company’s affiliated businesses.
- Losses on Marketable Equity Securities: There was a marked loss on marketable equity securities of (\$68.9 million) in Q1 2026, compared to a gain of \$43.8 million in the previous year. This swing may be price sensitive as it signals volatility in the company’s investment portfolio.
- Other Nonoperating Expenses: The company recorded other nonoperating expenses, net, of (\$428,000) in Q1 2026, compared to (\$4.07 million) in Q1 2025.
Balance Sheet Strength
- Total Current Assets: \$2.43 billion as of March 31, 2026.
- Cash and Cash Equivalents: \$267.0 million as of March 31, 2026 (up from \$266.9 million as of December 2025).
- Restricted Cash: \$63.4 million (up from \$44.4 million at year-end 2025).
- Investments in Marketable Equity Securities and Other Investments: \$972.7 million as of Q1 2026, down from \$1.09 billion as of December 31, 2025, reflecting the aforementioned losses in the investment portfolio.
- Property, Plant, and Equipment (Net): \$576.3 million.
- Goodwill (Net): \$1.60 billion, unchanged from the prior period.
Shareholder Information and Capital Structure
- Shares Outstanding (as of April 24, 2026):
- Class A Common Stock: 964,001 shares
- Class B Common Stock: 3,343,083 shares
- Listing: Shares are listed on the New York Stock Exchange.
- Filing Status: The company is a large accelerated filer and is not a shell company, smaller reporting company, or emerging growth company.
- Regulatory Compliance: The company has filed all reports required and submitted all interactive data files as required by the SEC.
Other Comprehensive Income Items
- Foreign Currency Translation Adjustments: Loss of (\$6.2 million) in Q1 2026, compared to a gain of \$14.3 million in Q1 2025, reflecting currency volatility that could impact future earnings.
- Pension and Other Postretirement Plans: Amortization of net prior service credit and other adjustments resulted in a loss of (\$754,000) in Q1 2026 versus (\$898,000) in Q1 2025.
- Cash Flow Hedges: Gain of \$626,000 for Q1 2026.
Investor Takeaways and Potential Share Price Impacts
- Strong Core Operating Performance: The increase in net income and EPS demonstrates robust underlying business operations, excluding investment portfolio volatility.
- Volatility in Investments: Substantial losses on marketable equity securities may create near-term volatility in the share price, especially for investors focusing on Graham Holdings’ investment activities.
- Positive Turnaround in Equity Earnings: The swing from a substantial loss to a large profit in equity method investments is a positive indicator, suggesting that affiliated businesses may now be contributing significantly to overall profitability.
- Balance Sheet Remains Strong: Healthy cash balances and total assets support the company’s flexibility for future investments, acquisitions, or shareholder returns.
- Foreign Exchange Risk: The negative impact from currency translation adjustments is a factor to monitor, particularly for international operations and investment exposure.
Conclusion
Graham Holdings Company delivered a solid Q1 2026 performance, with rising net income and EPS driven by strong operating results and a sharp turnaround in equity method investments. However, significant losses in the investment portfolio and foreign currency translation losses are important risk factors that could create share price volatility in the near term. Investors should closely monitor the company’s investment portfolio performance and international exposure.
Disclaimer: This article is for informational purposes only and does not constitute financial advice or a recommendation to buy or sell any securities. Investors should consult their own advisors before making investment decisions. The information is based on the company’s public SEC filings and may be subject to change.