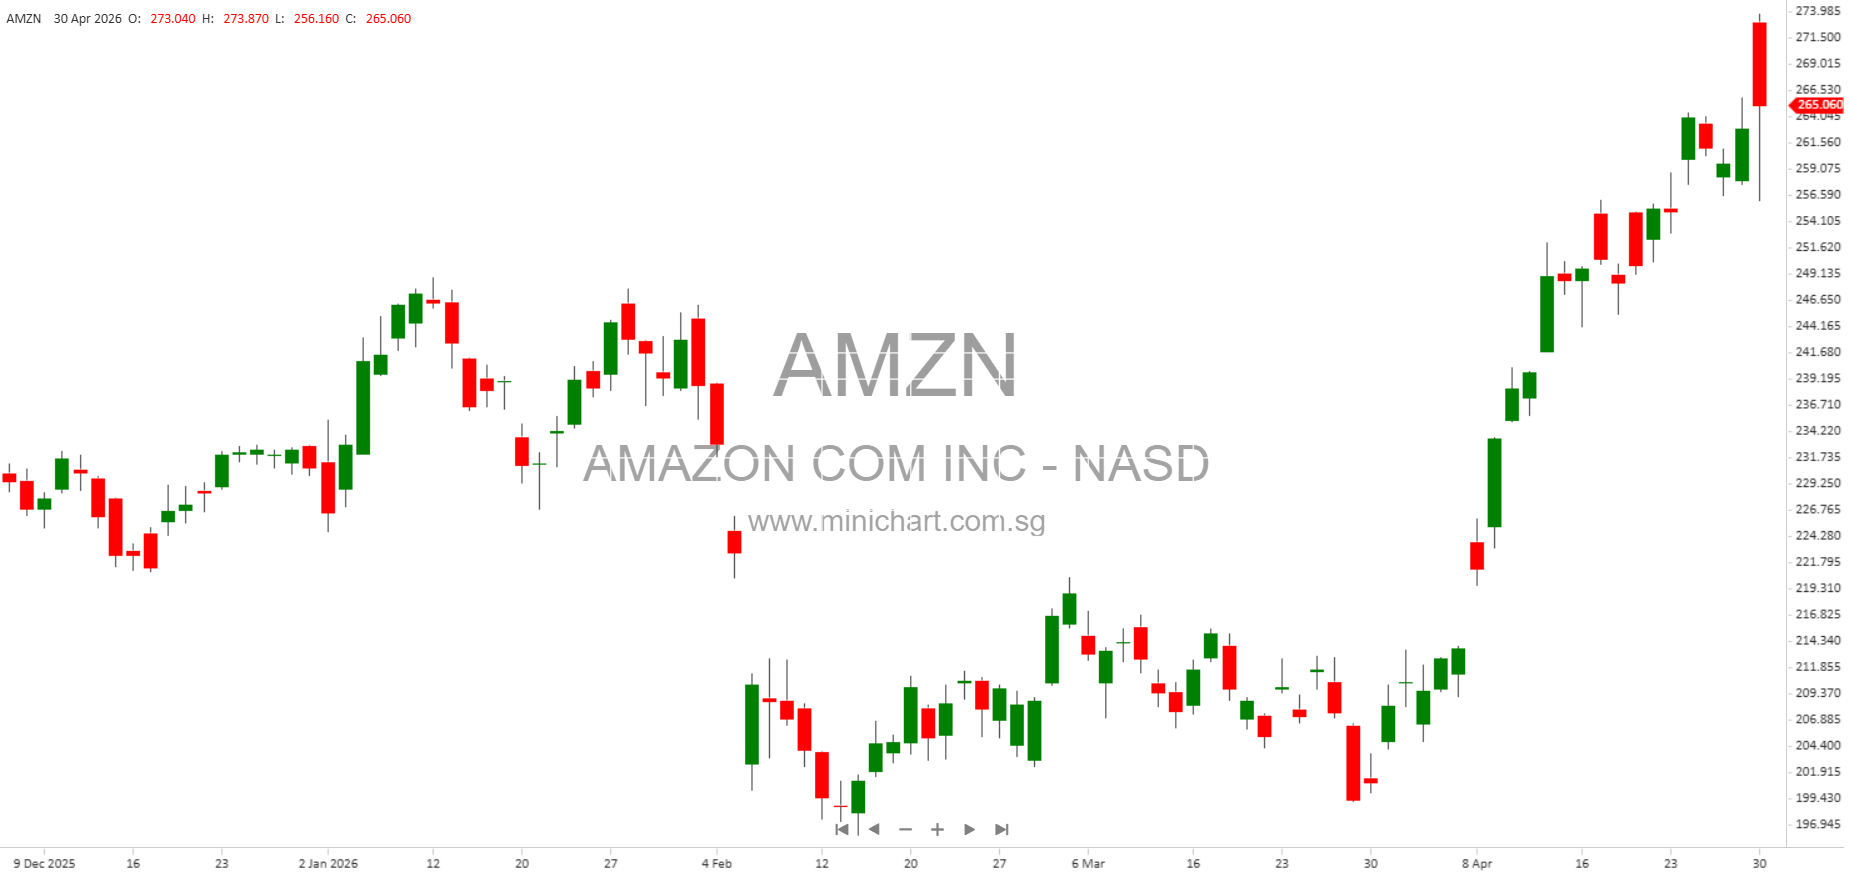
Amazon.com, Inc. Q1 2026 Financial Report: Detailed Investor Update
Key Points & Performance Highlights
- Quarterly Period Ended: March 31, 2026
- Report Type: Quarterly Report pursuant to Section 13 or 15(d) of the Securities Exchange Act of 1934 (Form 10-Q)
- Shares Outstanding: 10,757,109,436 common shares as of April 22, 2026
- Filing Status: Large Accelerated Filer
- Shell Company Status: Not a shell company
Financial Overview
Cash Flow Highlights
- Cash, Cash Equivalents, and Restricted Cash (Beginning of Period): \$82.3 billion
- Cash, Cash Equivalents, and Restricted Cash (End of Period): \$73.3 billion
- Net Cash Provided by Operating Activities (Trailing Twelve Months): \$148.5 billion
- Net Cash Used in Investing Activities (Trailing Twelve Months): -\$176.9 billion
- Net Cash Provided by Financing Activities (Trailing Twelve Months): -\$10.6 billion
Key Takeaway: Amazon continues to generate substantial cash flows from operations, but investing activities—primarily purchases of property, equipment, and marketable securities—outpace operating cash inflows. This is indicative of ongoing expansion and investment, which may pressure short-term liquidity but could drive long-term growth.
Income Statement Highlights
- Net Income (Q1 2026): \$17.1 billion
- Net Income (Trailing Twelve Months): \$30.3 billion
- Operating Income (Q1 2026): \$18.4 billion
- Interest Income (Q1 2026): \$1.1 billion
- Interest Expense (Q1 2026): \$541 million
- Income Before Taxes (Q1 2026): \$21.6 billion
- Income Tax Expense (Q1 2026): \$4.6 billion
- Basic Earnings Per Share (Q1 2026): \$1.62
- Diluted Earnings Per Share (Q1 2026): \$1.59
- Weighted-Average Shares (Basic): 10.8 billion
- Weighted-Average Shares (Diluted): 10.8 billion
- Comprehensive Income (Q1 2026): \$16.2 billion
- Comprehensive Income (Trailing Twelve Months): \$26.9 billion
Key Takeaway: Amazon delivered robust profitability and continued to grow its bottom line. Investors should note the consistency in both net income and comprehensive income, reflecting not only strong operational performance but also resilience in other comprehensive areas, including unrealized gains/losses on securities.
Balance Sheet Highlights
- Cash and Cash Equivalents (End of Q1): \$101.8 billion
- Marketable Securities (End of Q1): \$41.3 billion
Key Takeaway: Amazon maintains a highly liquid balance sheet. The large cash and marketable securities position provides flexibility for future investments, acquisitions, and shareholder value initiatives.
Debt and Financing Activities
- Proceeds from Short-Term Debt (Q1 2026): \$1.8 billion
- Proceeds from Long-Term Debt (Q1 2026): \$746 million
- Repayments of Long-Term Financing Obligations (Q1 2026): \$695 million
- Net Cash Used in Financing Activities (Q1 2026): \$47 million
Key Takeaway: Amazon’s debt activity in the quarter was moderate. The company raised both short-term and long-term debt but also made repayments, resulting in a small net cash outflow from financing activities. The overall debt management appears prudent and balanced.
Shareholder Information & Potential Price Sensitivity
- Common Stock Outstanding: 10.76 billion shares
- Trading Symbols: Common stock traded on Nasdaq; notes due 2028, 2030, 2032, 2035, 2039, 2064 are also listed, with no trading symbol but registered on Nasdaq.
- Large Accelerated Filer: Amazon remains a large accelerated filer, indicating timely financial reporting and market stability.
- No Shell Company Status: The company is not a shell company, confirming ongoing robust operations.
- Electronic Filing Compliance: All reports and data files were submitted electronically and timely.
- Emerging Growth Company Status: Amazon is not an emerging growth company and has not elected to use extended transition periods for new accounting standards.
Potential Share Price Sensitivity:
- Amazon’s strong cash reserves and profitability may positively influence investor sentiment and share values.
- Significant investing outflows, if not matched by future revenue growth, could concern shareholders about capital allocation.
- Consistent earnings per share and comprehensive income support the company’s valuation and could attract new investors.
- Debt issuance and repayments are balanced, reducing risk of over-leverage.
- No adverse reporting flags (such as shell company or late filings) provide reassurance to the market.
Conclusion
Amazon.com, Inc.’s Q1 2026 report demonstrates continued robust financial performance, high liquidity, prudent debt management, and consistently strong profitability. These factors are likely to be viewed positively by shareholders and may support further share price appreciation. Investors should monitor capital expenditure trends and marketable securities activity as ongoing investments are key to the company’s long-term growth strategy.
Disclaimer: This article is for informational purposes only and does not constitute investment advice. Investors should conduct their own research and consult financial advisors before making investment decisions. Financial data is based on Amazon.com, Inc.’s Q1 2026 SEC filings and may be subject to change.