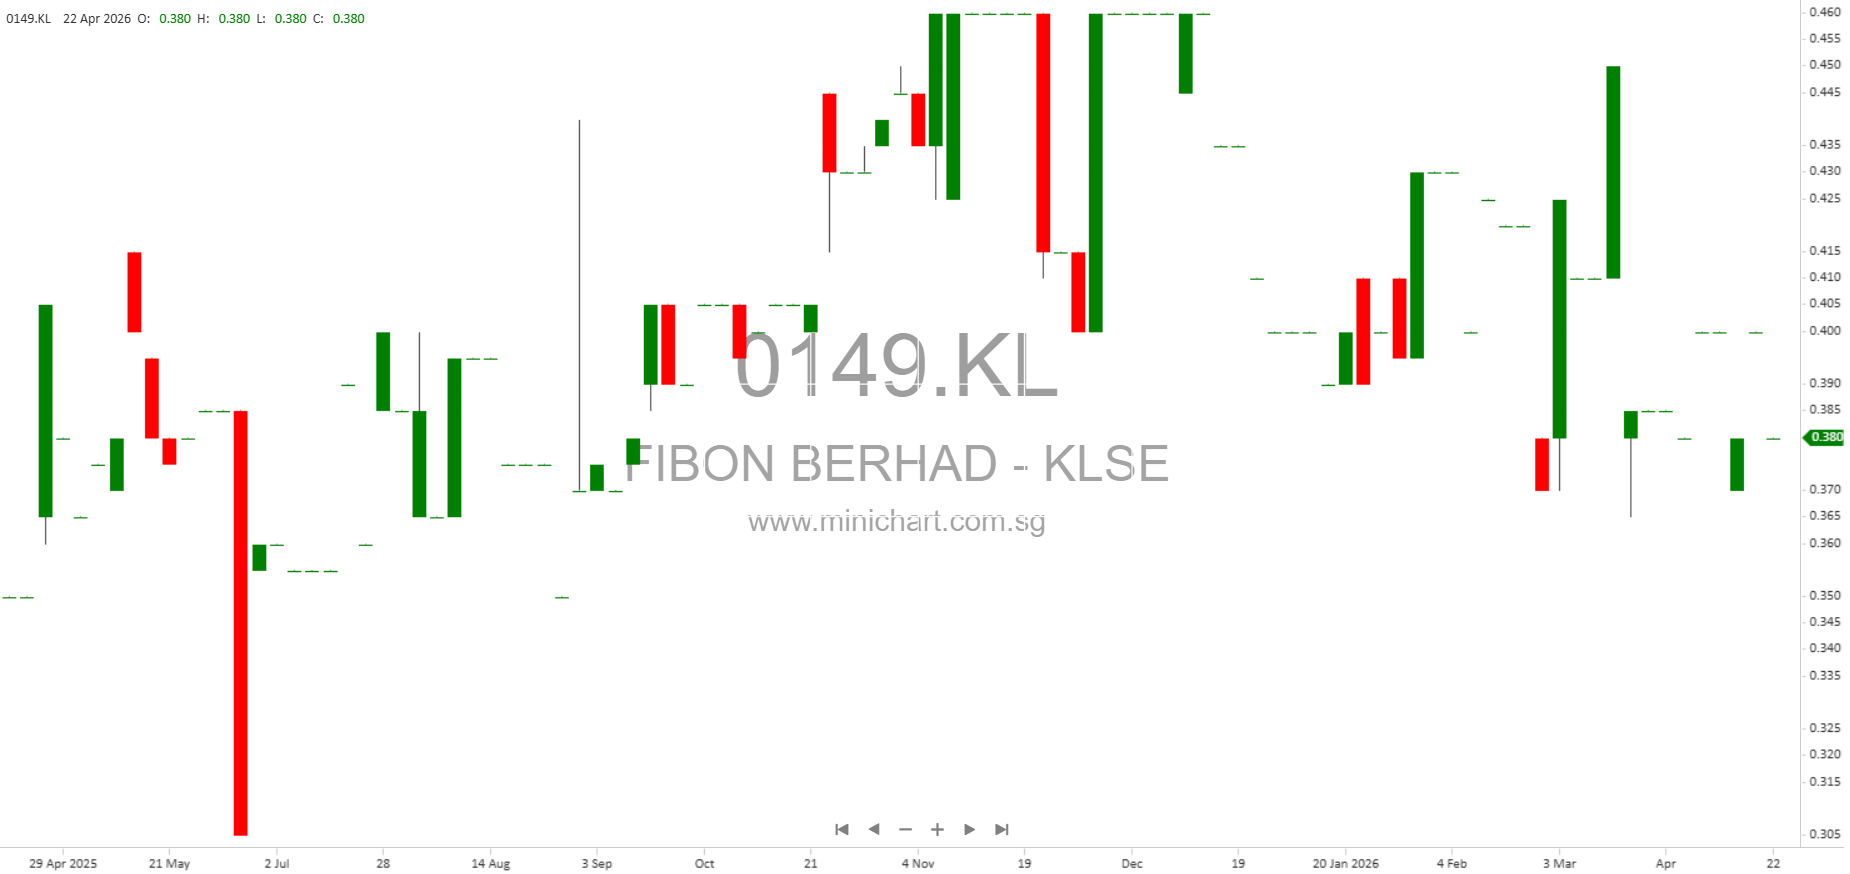
Fibon Berhad Q3 FY2026: Robust Financial Performance and Solid Outlook
Key Highlights from the Third Quarter Results Ended 28 February 2026
- Revenue Growth: Fibon Berhad reported a 21% increase in cumulative revenue for the nine months ended 28 February 2026, rising to RM19.61 million from RM16.43 million in the previous corresponding period. The latest quarter revenue stood at RM6.19 million, up 10% year-on-year.
- Profitability: Profit after tax (PAT) for the period surged by 47% year-on-year, standing at RM3.88 million versus RM2.64 million previously. For the quarter, PAT was RM1.05 million, a marginal increase from RM1.04 million in Q3 FY2025.
- Margin Improvement: Gross profit margin remained strong, with gross profit for the period at RM13.0 million (up from RM11.0 million), indicating stable operational efficiency despite rising administrative expenses.
- Healthy Cash Position: The Group remains highly liquid, with cash and bank balances of RM16.99 million and fixed deposits of RM28.60 million as at 28 February 2026, amounting to a total cash and deposits of RM45.60 million. Net cash and cash equivalents after deducting long-term deposits stood at RM30.60 million.
- No Borrowings: Fibon Berhad is debt-free as of the reporting date, offering significant financial flexibility.
- Dividend Paid: A final single-tier dividend of 1.10 sen per share, amounting to RM1.08 million, was paid on 29 December 2025.
- Earnings Per Share: Basic EPS for the quarter was 1.07 sen; cumulative EPS for nine months was 3.97 sen.
- Net Assets per Share: Increased to RM0.69 from RM0.66 as at 31 May 2025, reflecting growing shareholder value.
- No Material Litigation or Derivatives Exposure: There are no ongoing legal disputes or derivative exposures, reducing potential risks.
Segmental Performance Breakdown
- Sales of Goods: This segment continues to be the main revenue contributor, supported by increased manufacturing sales of electrical insulators, enclosures, switchboard parts, and meter boards.
- Investment Holding & Financing Income: Investment holding contributed RM2.04 million to revenue, while financing income contributed RM52,000, with segment profit from investment holding at RM1.31 million.
- Operating Expenses: Administrative expenses increased to RM7.69 million from RM7.24 million, signaling continued investment in operations and possibly higher costs.
Balance Sheet Strength
- Total Assets: RM71.34 million, up from RM68.31 million at the previous year-end.
- Shareholders’ Equity: RM67.57 million, an increase from RM64.75 million.
- Low Liabilities: Total liabilities remain low at RM3.77 million.
Cash Flows and Capital Expenditure
- Operating Cash Flow: Net cash from operations was RM5.57 million, up from RM3.56 million in the prior period, underlining strong cash generation ability.
- Capital Expenditure: RM1.31 million invested, including RM1.08 million for land and buildings, suggesting expansion or upgrading of facilities.
- No New Borrowings: The Group remains debt-free and did not issue or repay any debt or equity securities during the period.
Dividend and Shareholder Returns
- A single-tier final dividend of 1.10 sen per share was paid, demonstrating the Group’s commitment to rewarding shareholders.
- No interim dividend was declared for the quarter ended 28 February 2026.
Management Commentary and Outlook
- Despite global economic headwinds, including rising crude oil prices, supply chain disruptions, and unemployment, the Group remains confident and is focused on strengthening its core business segments and maintaining a healthy cash flow.
- No material events or changes in the Group’s structure occurred after the reporting period. There are also no contingent liabilities or assets.
- There was no issuance of profit forecasts or estimates for the period, indicating conservative guidance from the management.
What Investors Should Watch
- Consistent Profit Growth: The Group’s ability to grow revenue and profits while maintaining a strong balance sheet and cash position may be seen as highly positive and could support share price appreciation.
- Dividend Policy: The regular dividend payout is an attractive feature for income-focused investors.
- Capital Investments: The substantial investment in land and building may indicate capacity expansion or enhancement, which could translate into future revenue growth.
- No Borrowings: The debt-free status further enhances financial strength and reduces risk for shareholders.
- Cost Control: While administrative expenses have risen, the Group has managed to improve profit margins overall.
- No Legal or Derivatives Risks: The absence of litigation and derivatives exposure should provide confidence in risk management.
Potential Price-Sensitive Information
- Stronger than expected earnings growth and a robust balance sheet could positively influence share price.
- Continued dividend payments and capital investments may further support investor confidence.
- No negative surprises such as litigation, restructuring, or asset write-downs were reported.
- Overall, the results reflect stable operations, prudent management, and a commitment to shareholder returns.
Disclaimer: This article is prepared for informational purposes only and does not constitute investment advice. Investors are advised to conduct their own research or consult professional advisors before making investment decisions. The writer and publisher are not liable for any losses or damages arising from the use of this article.