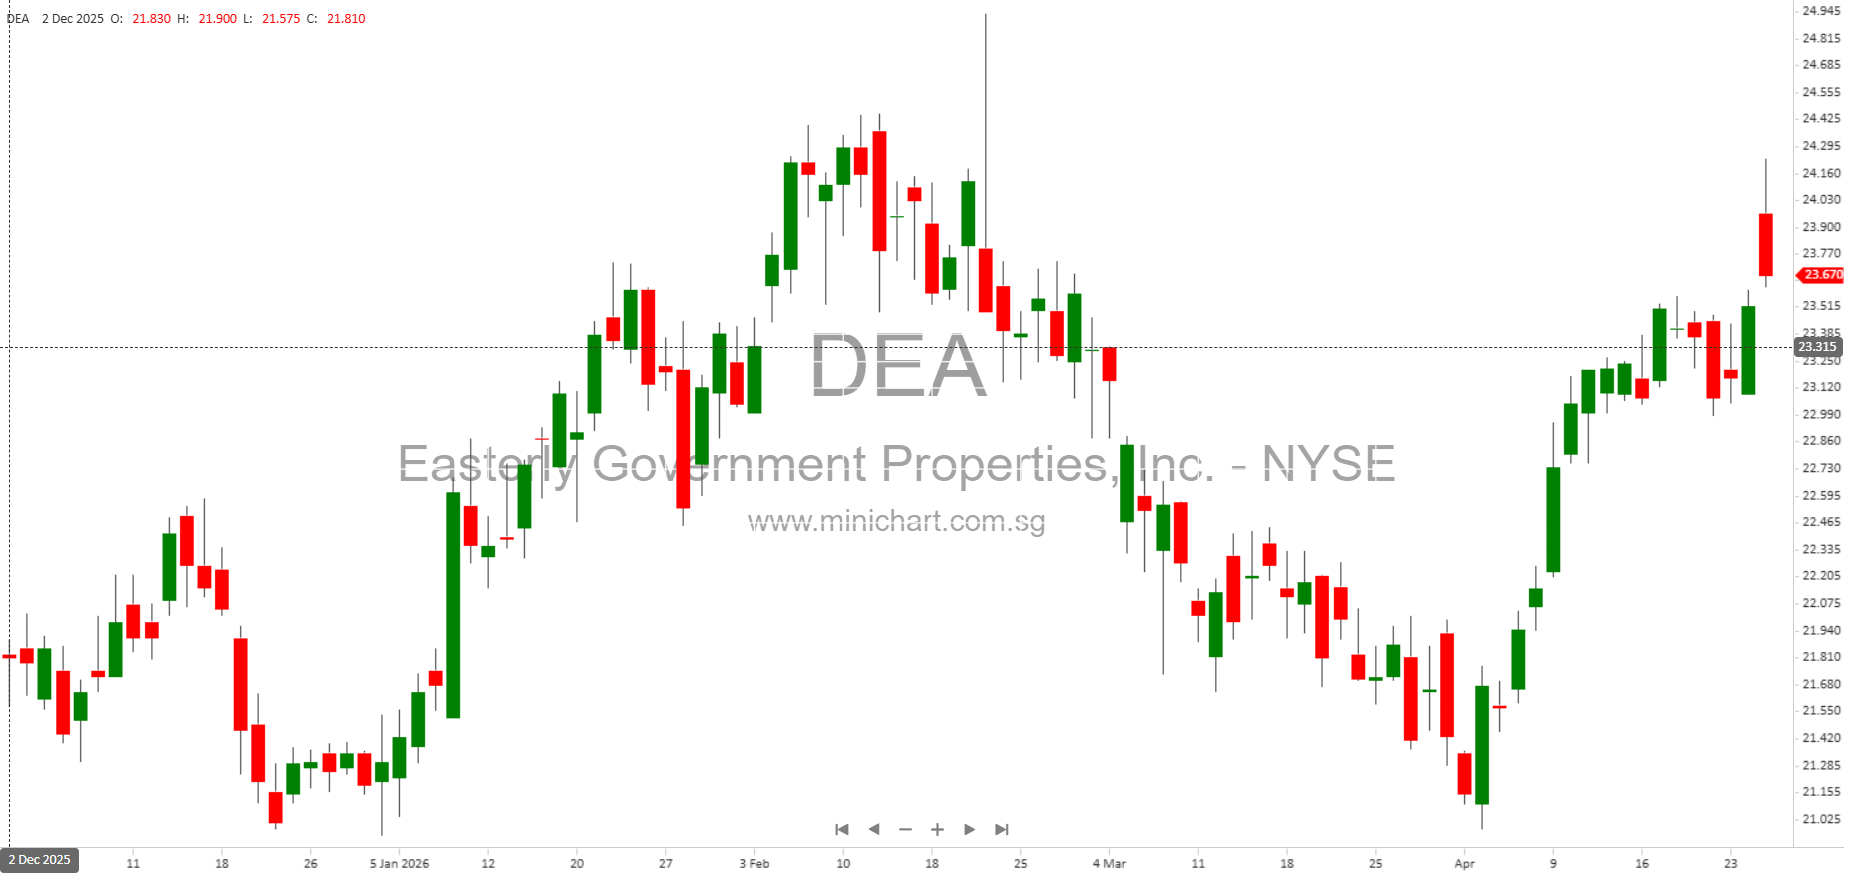
Easterly Government Properties, Inc. (NYSE: DEA) Announces First Quarter 2026 Financial Results
Key Highlights for Investors
- Net Income: \$1.4 million, or \$0.03 per share on a fully diluted basis for Q1 2026, compared to \$3.1 million, or \$0.07 per share in Q1 2025.
- Core Funds from Operations (Core FFO): \$37.1 million, or \$0.77 per share fully diluted, up from \$33.1 million, or \$0.73 per share in Q1 2025.
- Acquisition: Purchased a 297,713 square foot campus near Richmond, Virginia, primarily leased to the Commonwealth of Virginia, with lease expirations from 2027 to 2036.
- Mezzanine Loan: Entered into a \$7.0 million mezzanine construction loan agreement with a fixed 12% annual interest rate.
- ATM Program Activity: Issued 94,170 shares of common stock, raising approximately \$2.1 million at a weighted average price of \$23.01 per share through the Company’s \$300 million ATM program.
- Dividend: Declared a quarterly cash dividend of \$0.45 per share, payable May 21, 2026, to shareholders of record on May 7, 2026.
- Guidance Raised: Raised the lower end of full-year 2026 Core FFO guidance to a range of \$3.06 – \$3.12 per share (fully diluted).
- Development Pipeline: Three projects under construction in Flagstaff (AZ), Fort Myers (FL), and Medford (OR) totaling ~0.2 million rentable square feet, with long-term government leases expected upon completion.
- Balance Sheet: As of March 31, 2026, total indebtedness was ~\$1.72 billion, with a weighted average interest rate of 4.6% and average maturity of 3.9 years. Net Debt to total enterprise value was 62.5%; Adjusted Net Debt to annualized quarterly pro forma EBITDA was 7.3x.
- Portfolio: 106 operating properties (10.7 million leased sq. ft.); 93 to U.S. government, 8 to state/local agencies, and 5 to private tenants. Weighted average lease term of 9.4 years and portfolio age of 16.9 years.
Detailed Financial and Operational Analysis
1. Financial Performance
- Total Revenue: \$91.5 million for Q1 2026, up from \$78.7 million in Q1 2025. Rental income contributed \$88.6 million.
- Expenses: Increased to \$71.6 million (from \$58.8 million), driven by higher property operating expenses, real estate taxes, and depreciation/amortization.
- EBITDA: \$57.3 million (Q1 2026) compared to \$51.0 million (Q1 2025).
- Cash Available for Distribution (CAD): \$32.2 million, up from \$31.1 million a year prior.
- Weighted Average Shares (fully diluted): 48.0 million, up from 45.4 million in Q1 2025—reflecting equity issuance activity.
2. Portfolio and Development Activity
- Portfolio Size: 106 properties totaling 10.7 million leased sq. ft.
- Tenant Mix: 93 properties leased to federal agencies, 8 to state/local, 5 to private tenants.
- Development Pipeline:
- Flagstaff, AZ: 20-year lease with GSA for U.S. Judiciary upon completion.
- Fort Myers, FL: 25-year lease with Florida Department of Law Enforcement.
- Medford, OR: 20-year lease with GSA for U.S. Judiciary.
- Recent Acquisition: Three-asset campus near Richmond, VA, primarily leased to the Commonwealth of Virginia, with staggered lease expirations (2027-2036).
3. Capital Structure and Liquidity
- Total Indebtedness: \$1.72 billion, diversified among revolving credit, term loans, notes payable, and mortgage debt.
- Leverage Metrics: Net Debt to enterprise value of 62.5%, Adjusted Net Debt to pro forma EBITDA at 7.3x. Weighted average interest rate of 4.6% and 3.9-year average debt maturity.
- ATM Share Issuance: Utilized the ATM program for additional capital; raised \$2.1 million in Q1 2026.
4. Dividend Policy
- Dividend Announcement: Quarterly cash dividend of \$0.45 per share, consistent with prior payouts and supported by steady CAD and Core FFO performance.
5. Updated 2026 Outlook
- Guidance Raised: Core FFO guidance for 2026 increased to \$3.06 – \$3.12 per share (fully diluted), reflecting management’s confidence and anticipated acquisition and development activity.
- Assumptions: Guidance assumes \$50 million of wholly owned acquisitions and \$50-100 million in gross development investment for 2026.
Important Considerations and Potential Share Price Impacts
- Core FFO Guidance Raised: Investors may view the increased guidance positively, signaling confidence in continued earnings growth and operational stability.
- Mezzanine Loan Investment: The entry into mezzanine lending at a 12% fixed rate could enhance returns but introduces additional risk outside traditional property operations.
- Acquisition Activity: The purchase of a large, primarily government-leased campus in Virginia further diversifies the portfolio and extends the lease maturity profile.
- Leverage: Net Debt and leverage ratios remain elevated (Net Debt/EV at 62.5%, Adjusted Net Debt/EBITDA at 7.3x), which could be a concern if interest rates rise or refinancing becomes more difficult.
- Dividend Sustainability: The dividend remains well-supported by CAD, but with rising interest expense and leverage, future payout sustainability should be monitored.
- Government Tenant Concentration: The company remains highly dependent on U.S. government and related agencies, so any changes in government leasing or funding priorities could materially impact results.
Risks and Forward-Looking Statements
The company notes that actual results may differ materially from guidance, due to risks including but not limited to: government spending changes, interest rate fluctuations, tenant concentration, acquisition and development execution, and general economic conditions. Full details on risks can be found in the company’s SEC filings.
Conference Call Details
Management will hold a webcast and conference call at 11:00 am ET on April 27, 2026, to discuss Q1 results and answer investor questions. The webcast and a replay will be available in the Investor Relations section of the company website.
Disclaimer
This article is for informational purposes only and does not constitute financial or investment advice. Investors should consult the company’s filings and their financial advisor before making investment decisions. The author is not responsible for any investment actions taken based on this report.