Norfolk Southern Corporation Reports Q1 2026 Financial Results: Key Highlights and Investor Implications
Overview
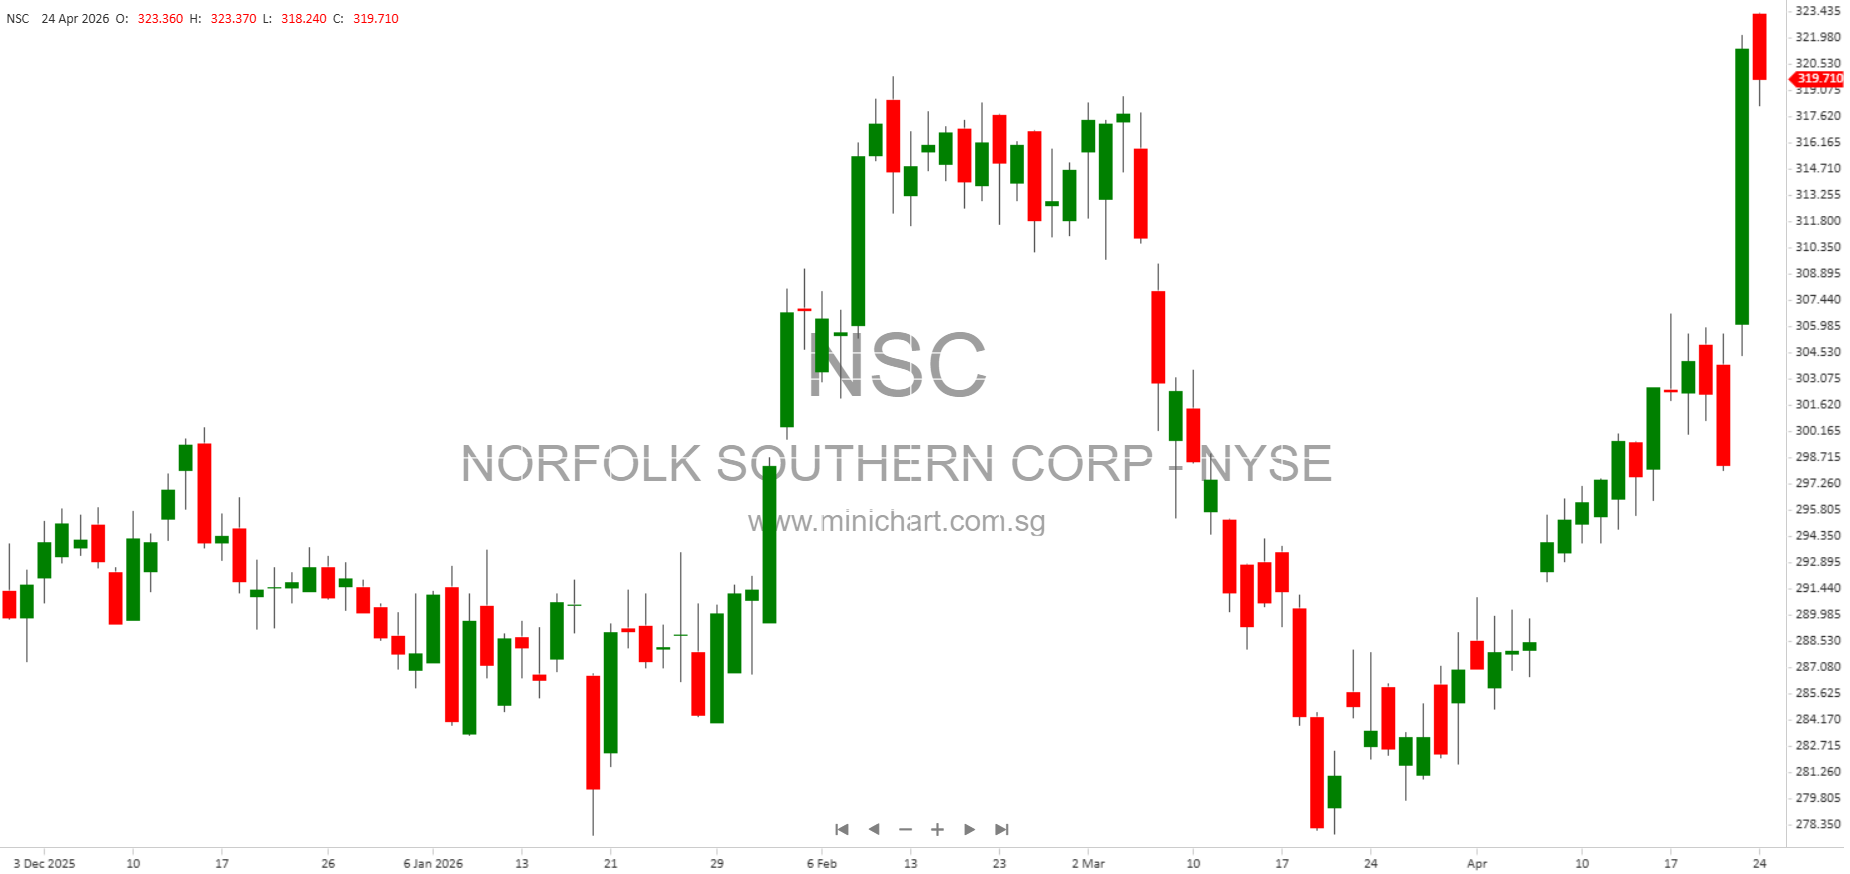
Norfolk Southern Corporation (NYSE: NSC), one of the leading U.S. rail transportation companies, has released its results for the first quarter ended March 31, 2026. The report provides investors and shareholders with a comprehensive look at the company’s financial performance, operational metrics, and capital allocation strategy.
Key Financial Highlights
- Net Income: Norfolk Southern reported net income of \$547 million for Q1 2026, a decrease from \$750 million in Q1 2025.
-
Earnings Per Share (EPS):
- Basic and Diluted EPS for Q1 2026 was \$2.43, down from \$3.31 in the prior year period.
- Total Revenue: (Not explicitly stated in the supplied pages, but critical for investors; please refer to official filings for detailed revenue numbers.)
- Total Comprehensive Income: Comprehensive income was \$546 million for Q1 2026, compared to \$751 million in Q1 2025.
- Cash Flow from Operations: Net cash provided by operating activities was \$950 million in Q1 2026.
- Total Assets: \$45.1 billion as of March 31, 2026.
- Total Stockholders’ Equity: \$15.8 billion as of March 31, 2026.
Capital Allocation and Dividends
- Dividends: The company declared a quarterly dividend of \$1.35 per share on common stock, consistent with the prior year.
- Total Dividend Payments: \$303 million was paid in Q1 2026 versus \$306 million in the prior year.
- Share Repurchases: The company repurchased and retired \$1 million in common stock during Q1 2026, down significantly from \$9 million in Q1 2025. This reduction in buybacks may impact share price support and investor sentiment.
- Stock-Based Compensation: \$16 million in stock-based compensation was issued during the quarter.
Balance Sheet Strength
- Current Assets: \$3.02 billion at March 31, 2026, compared to \$3.20 billion at year-end 2025.
- Investments: \$4.12 billion at March 31, 2026, up slightly from \$4.09 billion at year-end.
- Total Liabilities: \$29.3 billion as of March 31, 2026.
Share Count and Structure
- Shares Outstanding: 224,594,001 shares of common stock outstanding as of March 31, 2026 (excluding 20,320,777 shares held by subsidiaries).
Regulatory and Compliance Matters
- Filing Status: The company is a large accelerated filer and is in compliance with all SEC reporting requirements. It is not an emerging growth company and is not a shell company.
- Exchange Listing: Common stock is listed on the New York Stock Exchange under the trading symbol “NSC”.
Potential Price-Sensitive Issues for Shareholders
- Year-over-Year Profit Decline: The significant decline in net income and EPS (down approximately 27% year-over-year) is a potential concern for investors. This could exert downward pressure on the share price if the market perceives this as a sign of deteriorating fundamentals.
- Reduced Share Repurchases: A notable reduction in share buybacks in Q1 2026 compared to Q1 2025 may suggest a shift in capital allocation priorities or concerns about liquidity, which could affect investor confidence.
- Stable Dividends: The maintenance of the dividend at \$1.35 per share signals management’s commitment to returning capital to shareholders, a positive for income-focused investors.
- Balance Sheet Stability: Despite lower profits, the company maintains a strong balance sheet with substantial equity and liquidity, which may help support the share price during periods of earnings weakness.
Conclusion
Norfolk Southern’s first quarter results indicate a challenging operating environment, reflected in lower earnings and reduced buybacks, but the company remains committed to its dividend and maintains a robust financial position. Investors should closely monitor management commentary for insights into the causes of profit decline and any strategic changes in capital deployment.
Disclaimer: This article is for informational purposes only and does not constitute investment advice. Investors should conduct their own due diligence and consult with financial advisors before making any investment decisions. The information presented is based on the company’s Q1 2026 SEC filings and is believed to be accurate as of the date of publication, but no warranty is made as to its completeness or accuracy.