Halliburton Company Reports Robust Q1 2026 Earnings: Strong Profitability and Solid Balance Sheet
- Q1 2026 Net Income surged to \$464 million, more than double from \$203 million in Q1 2025.
- Earnings per share (EPS) for Q1 2026 were \$0.55 (basic and diluted), up from \$0.24 in Q1 2025.
- Balance sheet remains strong with total assets of \$25.1 billion and company shareholders’ equity at \$10.8 billion as of March 31, 2026.
- Operating income for Q1 2026 was \$670 million, compared to \$631 million in Q1 2025.
- Significant improvement in comprehensive income attributable to shareholders: \$481 million in Q1 2026, up from \$196 million in Q1 2025.
Financial Performance Overview
Halliburton Company delivered a standout performance in the first quarter of 2026, with net income reaching \$464 million. This marks a dramatic increase from \$203 million in the same quarter last year, highlighting a strong rebound in profitability. The company’s basic and diluted earnings per share both rose to \$0.55, more than double the prior year’s figure of \$0.24.
Operating income for the quarter was reported at \$670 million, demonstrating steady growth from \$631 million in Q1 2025. The improvement in net and operating income signals not only top-line growth but also effective cost management and operational efficiency.
Comprehensive Income and Shareholder Returns
Comprehensive income attributable to company shareholders reached \$481 million for Q1 2026, more than doubling the \$196 million achieved in the prior year’s first quarter. This robust performance is likely to positively influence shareholder sentiment and may have a direct bearing on the share price, given the company’s healthy financial trajectory.
The company maintained a consistent dividend policy, as evidenced by the strong retained earnings of \$15.4 billion as of March 31, 2026, up from \$15.0 billion at the end of 2025. This underlines Halliburton’s commitment to rewarding shareholders while retaining capital for growth and investment.
Balance Sheet Strength
Halliburton’s balance sheet remains robust, with total assets of \$25.1 billion and shareholders’ equity of \$10.8 billion as of March 31, 2026. The company reported cash and equivalents of \$2.9 billion and maintained a healthy current ratio, ensuring strong liquidity to support ongoing operations and potential strategic initiatives.
The company’s capital structure continues to be conservative, with common stock at \$2.66 billion and additional paid-in capital at \$1.12 billion. Treasury stock stood at \$6.9 billion, reflecting ongoing share buybacks and capital returns to shareholders.
Operational and Market Highlights
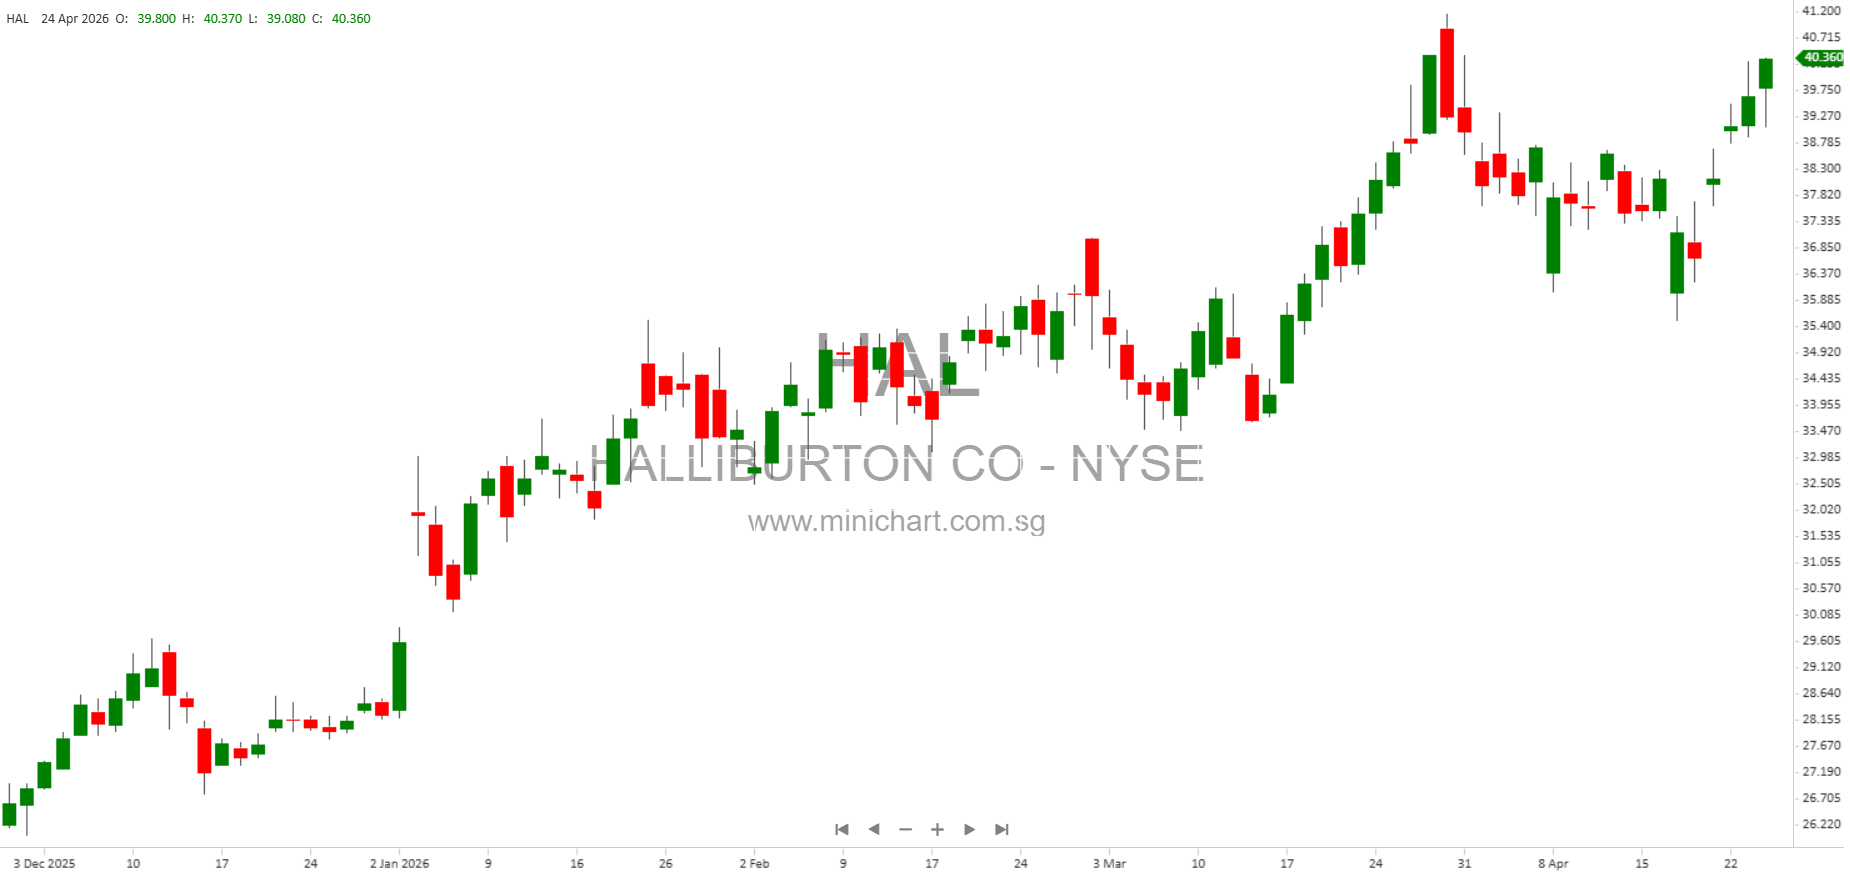
There were 835,397,735 shares of Halliburton common stock outstanding as of March 31, 2026. The company continues to be listed on the New York Stock Exchange under the symbol HAL, and remains in compliance with all regulatory and reporting requirements. The report confirms Halliburton’s status as a large accelerated filer, not a smaller reporting company or emerging growth company.
Potential Price-Sensitive Information
- Substantial year-over-year earnings growth is likely to strengthen investor confidence and could drive share prices higher.
- Strong balance sheet and liquidity enhance Halliburton’s ability to withstand market volatility and invest in future growth opportunities.
- No indication of significant impairments, restructuring, or negative surprises in the quarter, supporting a stable outlook for the company.
This article is a summary of Halliburton Company’s Q1 2026 financial report and is intended for informational purposes only. It does not constitute investment advice, an offer, or solicitation to buy or sell any securities. Investors should conduct their own due diligence and consult a qualified financial advisor before making investment decisions. The information presented is based on the company’s official filings and may be subject to change or interpretation.