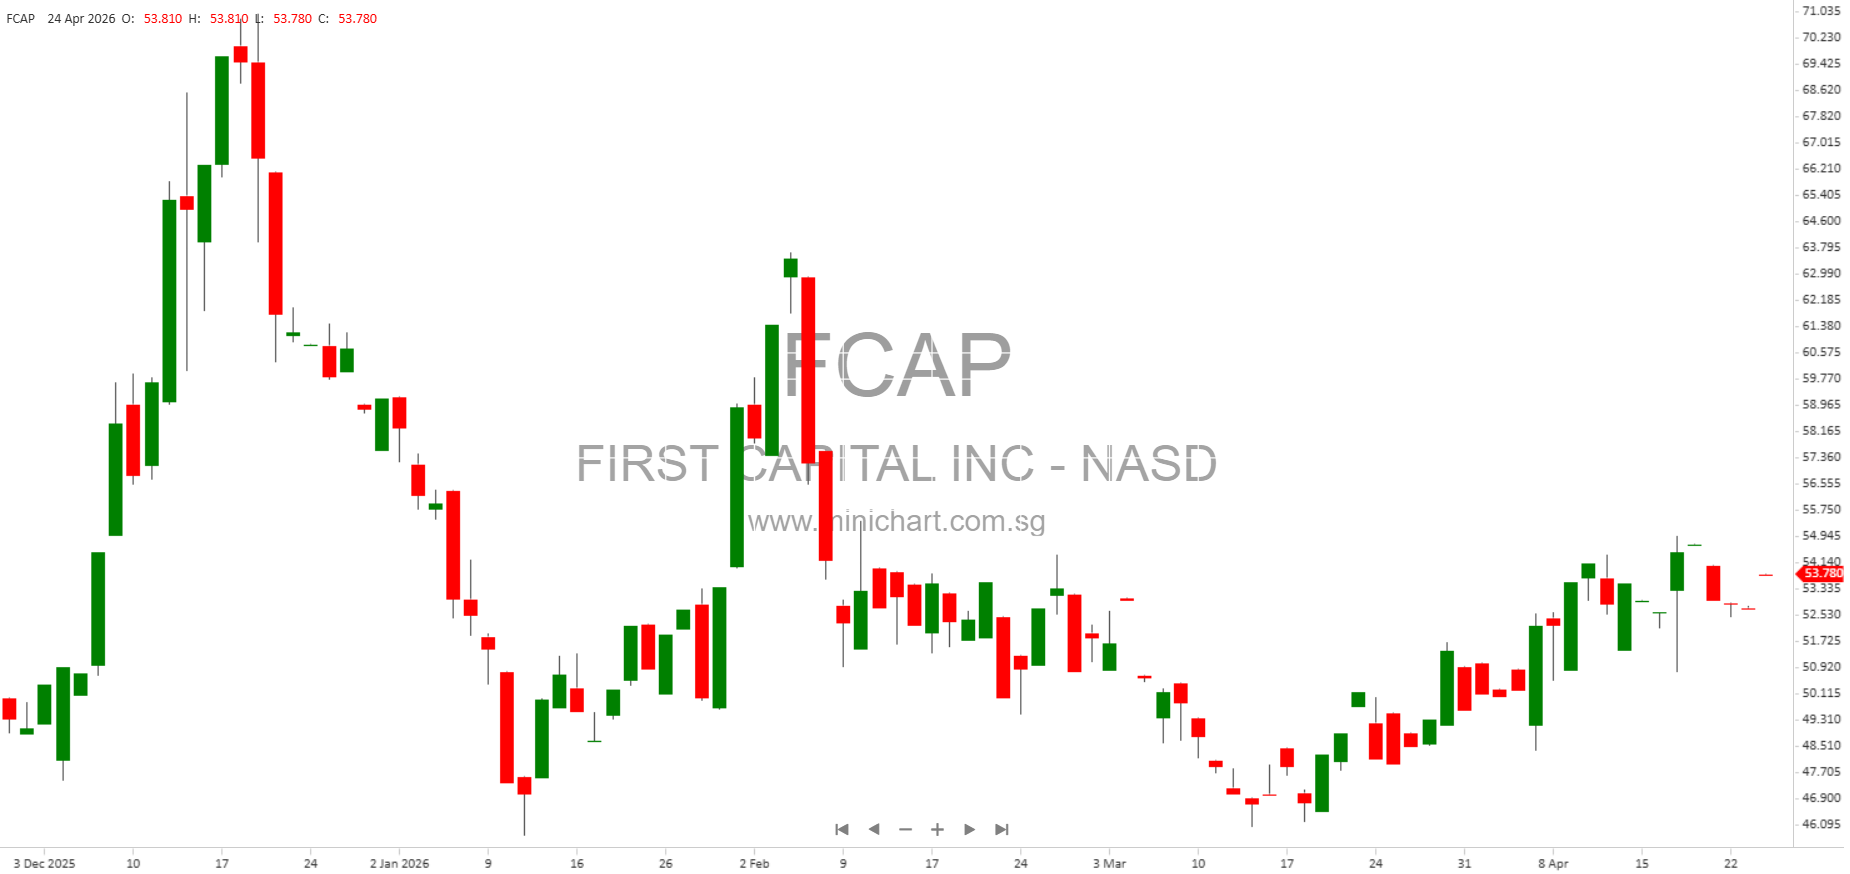
First Capital, Inc. Reports Robust Q1 2026 Earnings and Margin Expansion
Key Highlights
- Net income surged 34% year-over-year to \$4.3 million (\$1.30 per diluted share) for Q1 2026, up from \$3.2 million (\$0.97 per diluted share) in Q1 2025.
- Net interest margin (tax-equivalent basis) improved significantly to 3.81% from 3.34% in Q1 2025, reflecting a more profitable spread business.
- Return on average assets (ROAA) and equity (ROAE) increased to 1.37% and 12.36%, respectively, versus 1.08% and 11.12% a year ago.
- Dividend per share grew to \$0.31, up from \$0.29 in Q1 2025.
- Asset quality improved: Nonperforming assets declined to \$4.0 million from \$4.4 million at year-end 2025.
- Deposits expanded by \$13.6 million in the quarter to \$1.14 billion.
- Community Bank Leverage Ratio remained strong at 11.13%.
Detailed Financial and Operational Review
Quarterly Performance
First Capital, Inc. (NASDAQ: FCAP), the holding company for First Harrison Bank, delivered a standout performance in the first quarter of 2026. Net income attributable to common shareholders was \$4.33 million, or \$1.30 per diluted share, a sharp increase from \$3.24 million (\$0.97 per share) in the prior-year quarter. This robust growth was driven by a strong improvement in net interest income, effective cost management, and a favorable asset mix.
Net interest income after provision for credit losses rose by \$1.8 million year-over-year, driven by higher interest income and lower interest expense. Interest income increased by \$1.6 million, reflecting an increase in the average tax-equivalent yield on interest-earning assets from 4.63% to 4.96%, and a higher average asset balance (\$1.22 billion vs. \$1.17 billion). At the same time, interest expense fell by \$259,000 as the average cost of interest-bearing liabilities dropped to 1.56% from 1.71%, despite a higher average balance (\$901.4 million vs. \$881.6 million). As a result, the tax-equivalent net interest margin expanded by 47 basis points to 3.81%.
The provision for credit losses was slightly higher at \$350,000 compared to \$338,000 a year ago, consistent with the Bank’s measured risk posture. Net charge-offs were \$111,000, modestly up from \$84,000 in the prior-year period.
Noninterest Income and Expenses
Noninterest income improved by \$200,000 to \$2.05 million. The company benefited from a \$160,000 increase in gains on equity securities, and notable rises in ATM/debit card fee income (\$45,000) and gains on loan sales (\$44,000). These gains were partially offset by a larger loss on sale of available-for-sale securities (\$92,000 loss in Q1 2026 vs. \$55,000 loss in Q1 2025), as management repositioned the securities portfolio for higher future yields by selling \$18.7 million in securities.
Noninterest expenses grew by \$572,000 to \$7.75 million, primarily reflecting higher professional services fees (\$241,000), increased compensation and benefits (\$235,000, mainly due to salary adjustments and higher health insurance costs), and a rise in other expenses (\$99,000), which included increased consumer fraud losses.
Tax and Effective Rate
Income tax expense increased by \$358,000, resulting in a higher effective tax rate of 19.2% compared to 17.2% in the prior year, owing to a greater proportion of income being taxable.
Balance Sheet and Asset Quality
Total assets reached \$1.28 billion at March 31, 2026, up from \$1.27 billion at year-end 2025. Cash and cash equivalents increased by \$12.4 million, and net loans receivable rose by \$10.3 million. Available-for-sale securities declined by \$9.4 million, consistent with the aforementioned portfolio repositioning. Deposits ended the period at \$1.14 billion, up \$13.6 million from year-end. Importantly, nonperforming assets improved to \$4.0 million from \$4.4 million at December 31, 2025, signaling stable asset quality.
The Bank’s allowance for credit losses stood at 1.53% of gross loans, a slight increase from 1.52% at year-end, reflecting a prudent credit risk management approach.
The Community Bank Leverage Ratio was a healthy 11.13%, well above regulatory minimums, highlighting balance sheet strength.
Branch Network and Market Presence
First Harrison Bank operates 17 branch offices across several Indiana and Kentucky communities, providing robust local market coverage and digital banking services.
Potential Shareholder Impact and Price-Sensitive Information
- Significant net income and earnings per share growth could drive positive investor sentiment and support share price appreciation.
- The notable expansion in net interest margin demonstrates improved core profitability, which may be viewed favorably by the market.
- Deposit growth and improved asset quality reinforce the company’s stability and ability to generate recurring income.
- Dividend increase signals confidence in ongoing earnings strength and commitment to shareholder returns.
- The strategic repositioning of the securities portfolio, despite short-term losses, positions the company for higher yields in future periods.
Forward-Looking Considerations
Management notes that forward-looking statements are subject to risks including economic conditions, interest rate changes, competition, regulatory changes, credit quality, and other factors. Investors should be mindful of these risks when assessing future performance.
Contact
Joshua P. Stevens, Chief Financial Officer
Phone: 812-738-1570
Disclaimer: This article is for informational purposes only and does not constitute investment advice. Please refer to official filings and consult with a financial advisor before making investment decisions. Forward-looking statements are subject to risks and uncertainties that could cause actual results to differ materially.