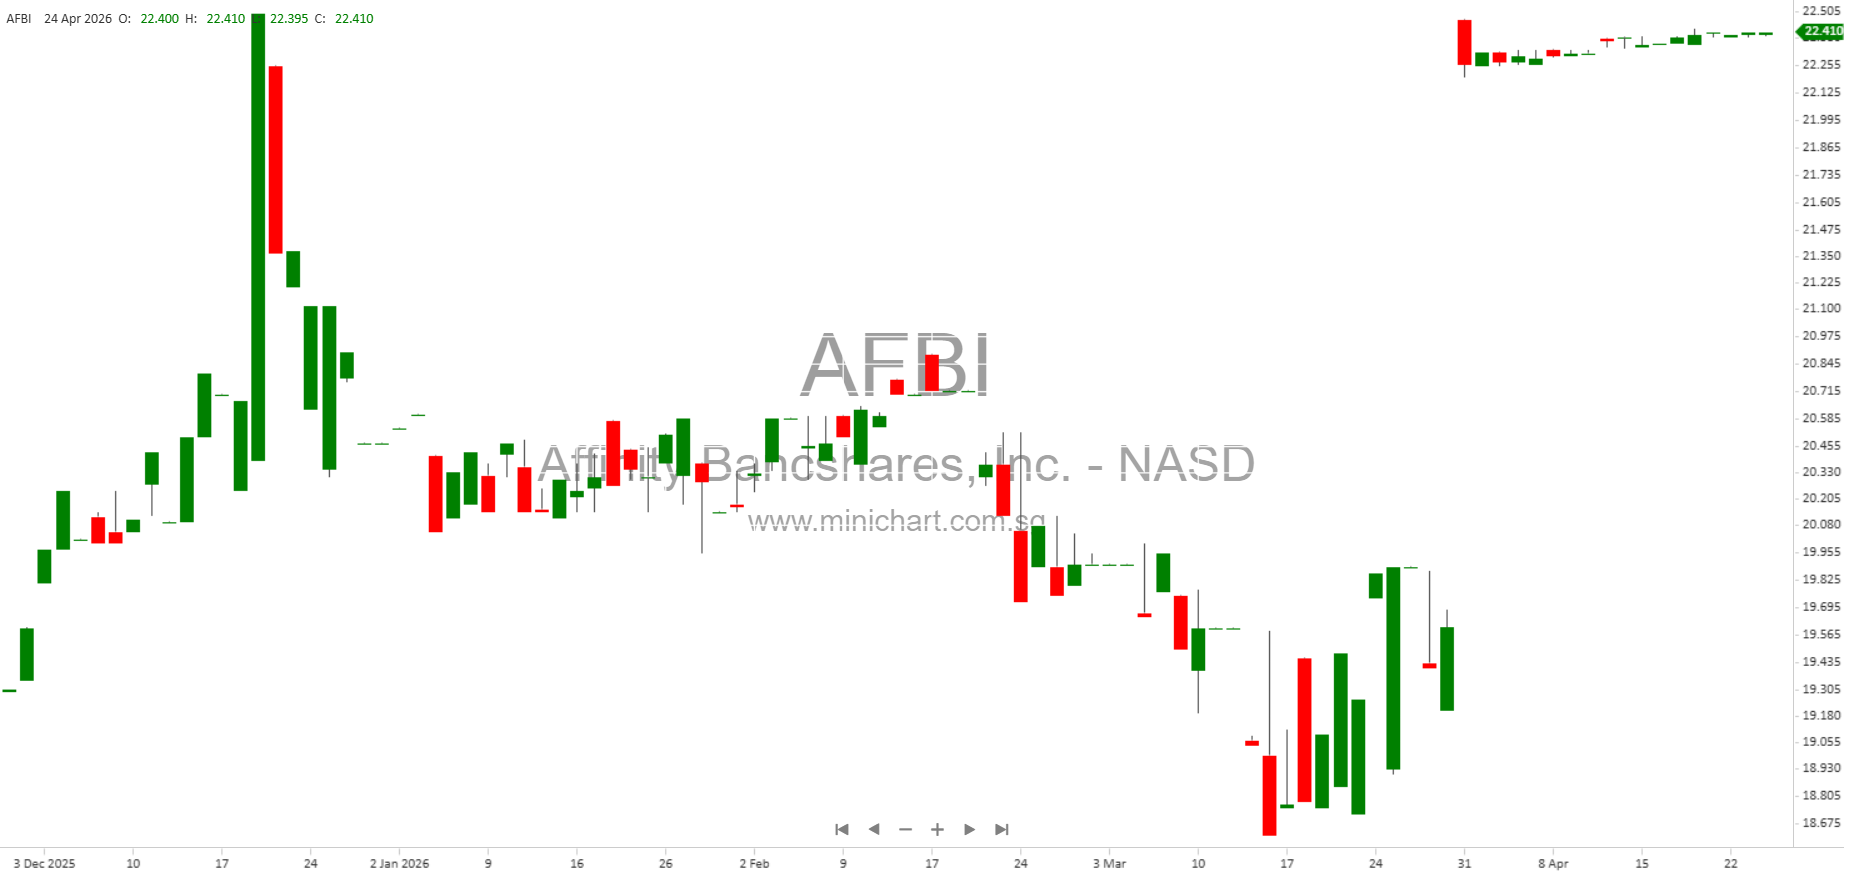
Affinity Bancshares, Inc. Announces Strong Q1 2026 Results: Net Income Jumps, Asset Growth Accelerates
Key Financial Highlights
- Net Income: \$2.3 million for Q1 2026, up from \$1.8 million in Q1 2025.
- Diluted Earnings Per Share (EPS): \$0.36, compared to \$0.28 in the prior year.
- Total Assets: \$924.7 million as of March 31, 2026, up \$43.0 million from December 31, 2025.
- Return on Average Assets (ROAA): 1.00% in Q1 2026, up from 0.83% in Q1 2025.
- Return on Average Equity (ROAE): 7.19%, up from 5.68% in Q1 2025.
- Book Value Per Share: \$21.24, up from \$19.25 a year ago.
- Tangible Book Value Per Share: \$18.30, up from \$16.40 a year ago.
- Efficiency Ratio: 64.25% in Q1 2026, improved from 68.55% in Q1 2025.
- Net Interest Margin: 3.50%, slightly down from 3.52% in Q1 2025.
In-Depth Results and Shareholder-Relevant Developments
1. Substantial Income and Profitability Growth
Affinity Bancshares, Inc. (NASDAQ: AFBI) delivered a robust increase in profitability for Q1 2026, with net income surging to \$2.3 million, a 24.8% year-over-year increase. Diluted EPS rose to \$0.36, up from \$0.28, reflecting both improved earnings and effective share management. The company’s return on average assets and equity also saw marked improvements, signaling efficient capital utilization and higher profitability.
2. Asset and Loan Portfolio Expansion
Total assets climbed to \$924.7 million as of March 31, 2026, up significantly from \$881.7 million at the end of 2025. This growth was largely driven by:
- Loan Growth: Gross loans increased \$9.1 million to \$751.8 million, with steady demand in commercial and industrial, and construction loans. Non-owner occupied office loans accounted for \$39.6 million, with a conservative average loan-to-value (LTV) of 44%. This includes \$15.2 million to medical/dental tenants and \$24.6 million to other tenants.
- Deposit Growth: Deposits rose by \$39.3 million to \$734.3 million, with demand deposits increasing by \$41.1 million and a marginal decrease of \$1.9 million in certificates of deposit. The increase in deposits directly supported the expansion in loans and interest-earning deposits.
- Cash and Equivalents: Cash reserves grew by \$35.5 million to \$89.4 million, reflecting increased liquidity and deposit inflows.
3. Net Interest Income and Margin Developments
- Net Interest Income: Rose to \$7.6 million (from \$7.3 million), driven by higher interest income on loans and deposits. This was offset slightly by increased deposit costs and lower interest on investment securities.
- Net Interest Margin: Slightly contracted by two basis points to 3.50%, but remains robust relative to peers.
- Noninterest Income: Increased to \$552,000 (up \$71,000), mainly due to higher service charges and loan-related fees, especially in indirect auto lending.
- Noninterest Expense: Decreased by \$143,000 to \$5.2 million, primarily due to lower salaries and employee benefits, helping drive efficiency improvements.
4. Asset Quality and Credit Risk
- Non-Performing Loans: Fell to \$3.5 million from \$3.6 million, showing stabilization in credit quality.
- Allowance for Credit Losses: Coverage ratio was strong at 251.8% of non-performing loans. Allowance as a percentage of total loans was 1.18%, down slightly from 1.21%.
- Net Loan Recoveries: \$105,000 for Q1 2026, compared to net charge-offs of \$89,000 in Q1 2025.
5. Capital and Shareholder Value Metrics
- Equity: Increased by \$2.4 million to \$129.5 million, mainly due to earnings growth, partially offset by unrealized securities losses of \$148,000 (net of tax).
- Book Value Per Share: Grew to \$21.24, while tangible book value per share increased to \$18.30.
- Equity/Asset Ratio: 14.00% (tangible equity/tangible assets: 12.29%), both very healthy and well above regulatory minimums.
- Unrealized Losses on Securities: \$3.8 million (net of tax) on available-for-sale securities—investors should monitor this in the context of interest rate risk and potential future mark-to-market impacts.
6. Operational and Strategic Notes
- Affinity Bank continues to operate in the metro Atlanta area, with a branch network and loan production offices serving key Georgia markets.
- The bank maintained a strong efficiency ratio (64.25%) and further reduced noninterest expenses, underscoring a disciplined approach to cost control.
Potential Price-Sensitive and Shareholder-Impacting Issues
- Robust Profit and Asset Growth: The significant increases in net income, assets, and deposits are likely to be viewed positively by investors and could support share price appreciation.
- Improved Asset Quality and Recoveries: Lower non-performing loans and positive net recoveries signal effective risk management, which may reduce future credit costs and volatility.
- Rising Book Value: The growth in both book and tangible book value per share enhances underlying shareholder value, supporting the investment thesis for long-term holders.
- Interest Rate and Securities Risk: While earnings and capital are strong, the \$3.8 million unrealized loss on available-for-sale securities should be monitored, as further rate increases or valuation declines could pressure capital and earnings.
- Operational Efficiency: The company’s ability to cut expenses while growing revenue and controlling credit costs is a notable positive.
Outlook and Forward-Looking Statements
Management remains optimistic but cautions that future results are subject to risks including changes in interest rates, asset quality, regulatory requirements, technology/security threats, and broader economic conditions. Investors should be aware that forward-looking statements are inherently uncertain and actual results may differ.
Disclaimer: This article is for informational purposes only and does not constitute investment advice. Investors should conduct their own analysis and consult with their financial advisor before making investment decisions. The information herein is based on company filings and is subject to change without notice. Affinity Bancshares, Inc. is subject to various risks and uncertainties as described in its SEC filings and other public disclosures.