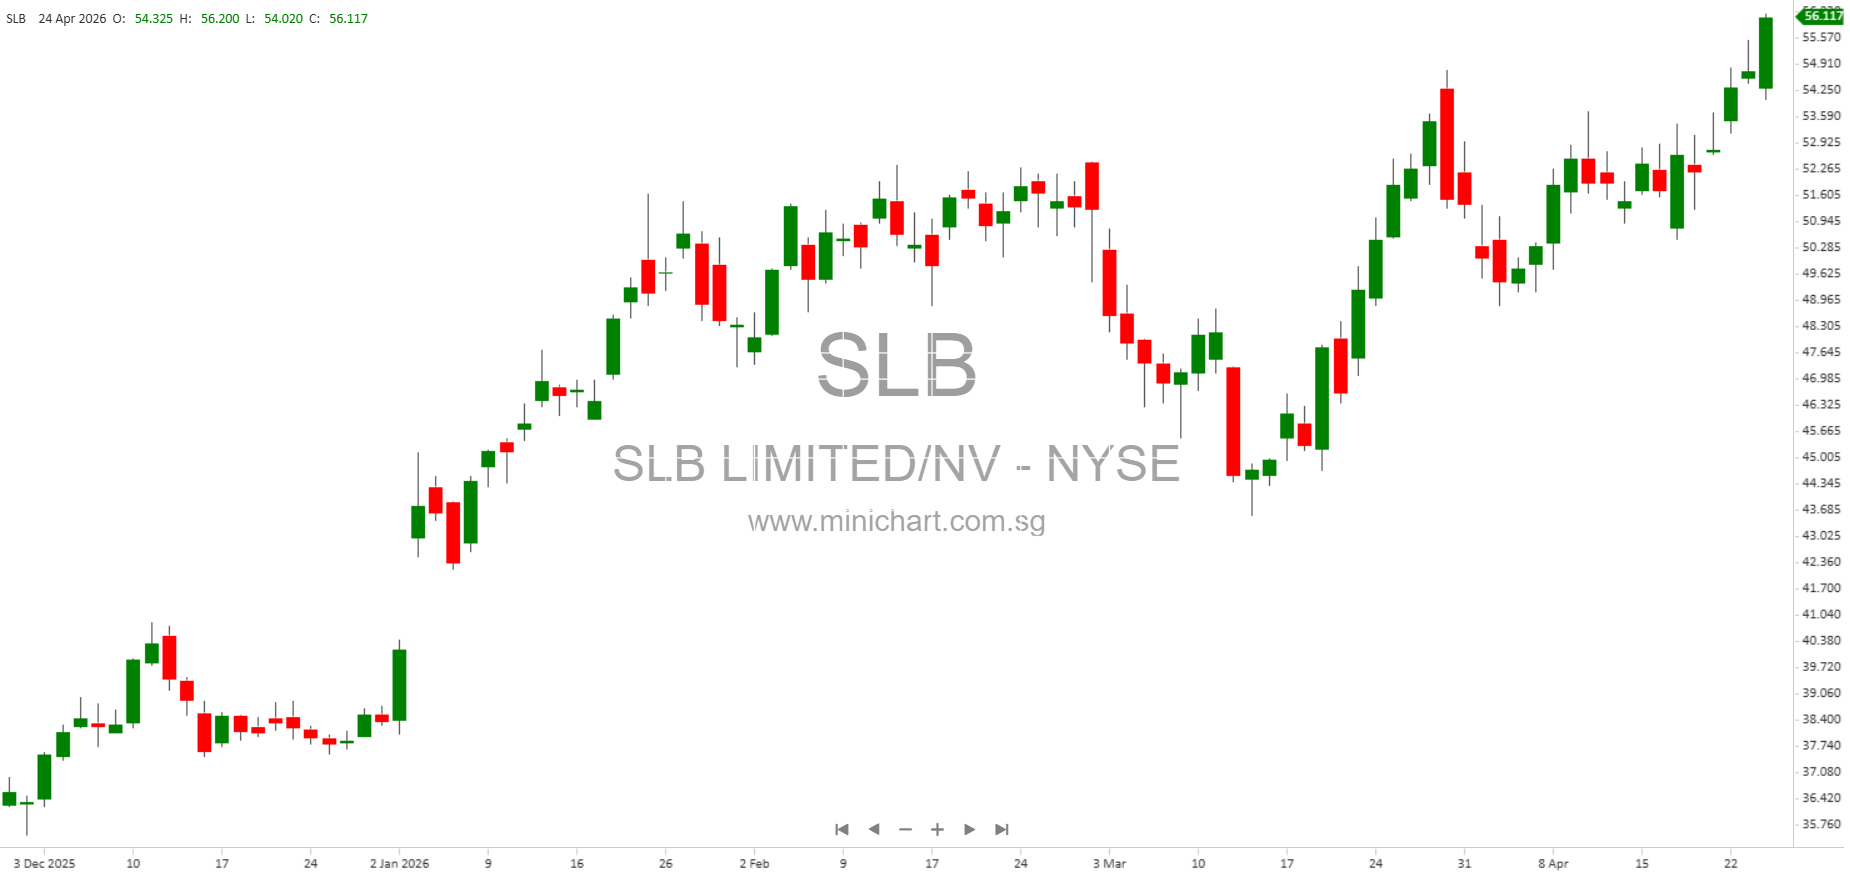
SLB Reports Q1 2026 Results: Revenue Grows, Margins Under Pressure, ChampionX Integration Delivers Growth
Key Financial Highlights
- Revenue: \$8.72 billion, up 3% year-on-year
- GAAP Net Income: \$752 million, down 6% year-on-year
- GAAP EPS: \$0.50, down 14% year-on-year
- EPS (Excluding Charges & Credits): \$0.52, down 28% year-on-year
- Adjusted EBITDA: \$1.77 billion, down 12% year-on-year
- Adjusted EBITDA Margin: 20.3%, versus 23.8% a year ago
- Cash Flow from Operations: \$487 million
- Free Cash Flow: Negative \$23 million
- Dividend: Quarterly cash dividend of \$0.295 per share approved
- Share Repurchases: 9.2 million shares bought back for \$451 million during the quarter
Detailed Performance Review
Revenue and Profitability
SLB delivered a 3% year-over-year revenue growth in Q1 2026, totaling \$8.72 billion. This was primarily driven by the integration of ChampionX, which contributed significantly to Production Systems revenue, resulting in a 23% year-on-year increase in that division. Excluding ChampionX, core revenue declined 6% year-on-year, indicating ongoing challenges in the broader market.
Despite the top-line growth, profitability came under pressure. GAAP net income fell 6% to \$752 million, and diluted EPS dropped to \$0.50, a 14% decline from the prior year. Excluding charges and credits, EPS was \$0.52, down 28%. Adjusted EBITDA was \$1.77 billion, reflecting a 12% decline, with EBITDA margin contracting by 346 basis points to 20.3%. The company cited seasonally lower digital sales and margin compression as key factors.
Segment Results
- Digital Division: Revenue rose 9% year-on-year to \$640 million, driven by 87% growth in Digital Operations and a 2% increase in Platforms & Applications. However, revenue fell 22% sequentially due to seasonally lower activity after a strong Q4 2025. ARR reached \$1.02 billion, up 15% year-on-year. Pretax operating margin declined 28 bps year-on-year to 20.9%, and adjusted EBITDA margin was 26.1%.
- Production Systems: Revenue surged 23% to \$3.51 billion, reflecting the inclusion of ChampionX. Pretax operating income was \$497 million, with a margin of 14.2%.
- Reservoir Performance and Well Construction: Both segments saw revenue and profitability declines year-on-year, with margins contracting and adjusted EBITDA down by double digits.
Geographic Performance
- North America: Revenue increased 26% year-on-year, driven by higher short-cycle project activity.
- International Markets: Revenues were mixed, with slight increases in Europe & Africa and declines in the Middle East & Asia due to ongoing geopolitical uncertainties and seasonality.
Strategic and Shareholder Actions
- The board approved a quarterly cash dividend of \$0.295 per share, underscoring SLB’s confidence in its cash flow generation and commitment to shareholder returns.
- SLB repurchased 9.2 million shares for \$451 million, signaling management’s view that the shares are undervalued or a strong commitment to return capital to shareholders.
- The company reiterated its objective to return more than \$4 billion to shareholders in 2026 through dividends and buybacks.
Liquidity and Balance Sheet
- Net Debt Position: Ended the quarter at \$8.2 billion, up from \$7.4 billion at year-end 2025. The increase reflects negative free cash flow, ongoing share repurchases, and dividend payments.
- Cash and Short-term Investments: \$3.39 billion as of March 31, 2026.
- Capital Investment: Guidance for full-year 2026 is \$2.5 billion, in line with 2025.
ChampionX Acquisition Update
The addition of ChampionX remains a major strategic move, delivering accretive growth and margin expansion to Production Systems. Management emphasized that ChampionX was the primary driver of year-on-year revenue growth, and the acquisition is expected to continue supporting earnings and cash flow.
Market Conditions and Outlook
Management highlighted ongoing geopolitical risks, particularly in the Middle East, as a key factor impacting global energy supply chains. SLB expects post-conflict commodity prices to remain elevated relative to pre-conflict levels due to supply disruptions and geopolitical risk premiums. The company anticipates that customers will prioritize supply diversification and increased investment in both short-cycle (North America, Latin America) and long-cycle (deepwater offshore) projects once the geopolitical environment stabilizes.
Management remains optimistic for a broad-based recovery in upstream markets in 2027 and 2028, barring a prolonged conflict and resultant demand destruction.
Other Notable Events
- The SLB OneSubsea joint venture entered into an agreement to acquire the subsea business of another company, indicating continued focus on expanding high-margin, technology-driven segments.
Potential Share Price Drivers and Risks
- Positive: Steady revenue growth, robust ARR in Digital, successful ChampionX integration, and strong capital returns policy are all supportive of share value.
- Negative: Margin compression, negative free cash flow this quarter, and increased net debt are points of concern. Any prolonged geopolitical instability or oil market downturn could intensify these pressures.
- Other Risks: Integration risks with ChampionX, ongoing margin pressures, and the need to execute on cost controls and capital allocation.
Shareholder Information
- Outstanding Shares: 1.495 billion as of March 31, 2026 (unchanged from December 31, 2025).
- Conference Call: April 24, 2026, at 11:00 a.m. ET. Access via webcast or dial-in; replay available until May 1, 2026.
Conclusion
While SLB’s Q1 2026 results reveal resilience in top-line growth and continued strategic investment through ChampionX, the company is navigating margin pressures and negative free cash flow, which may weigh on near-term share performance. However, the robust capital return policy, ongoing integration of accretive assets, and positive outlook for upstream markets post-conflict offer longer-term upside potential for investors.
Disclaimer: This article is for informational purposes only and does not constitute investment advice. Investors should review SLB’s official filings and consult with a financial advisor before making investment decisions. Past performance is not indicative of future results. Forward-looking statements are subject to significant risks and uncertainties.