OP Bancorp Q1 2026 Earnings Report: Key Highlights and Investor Insights
Overview
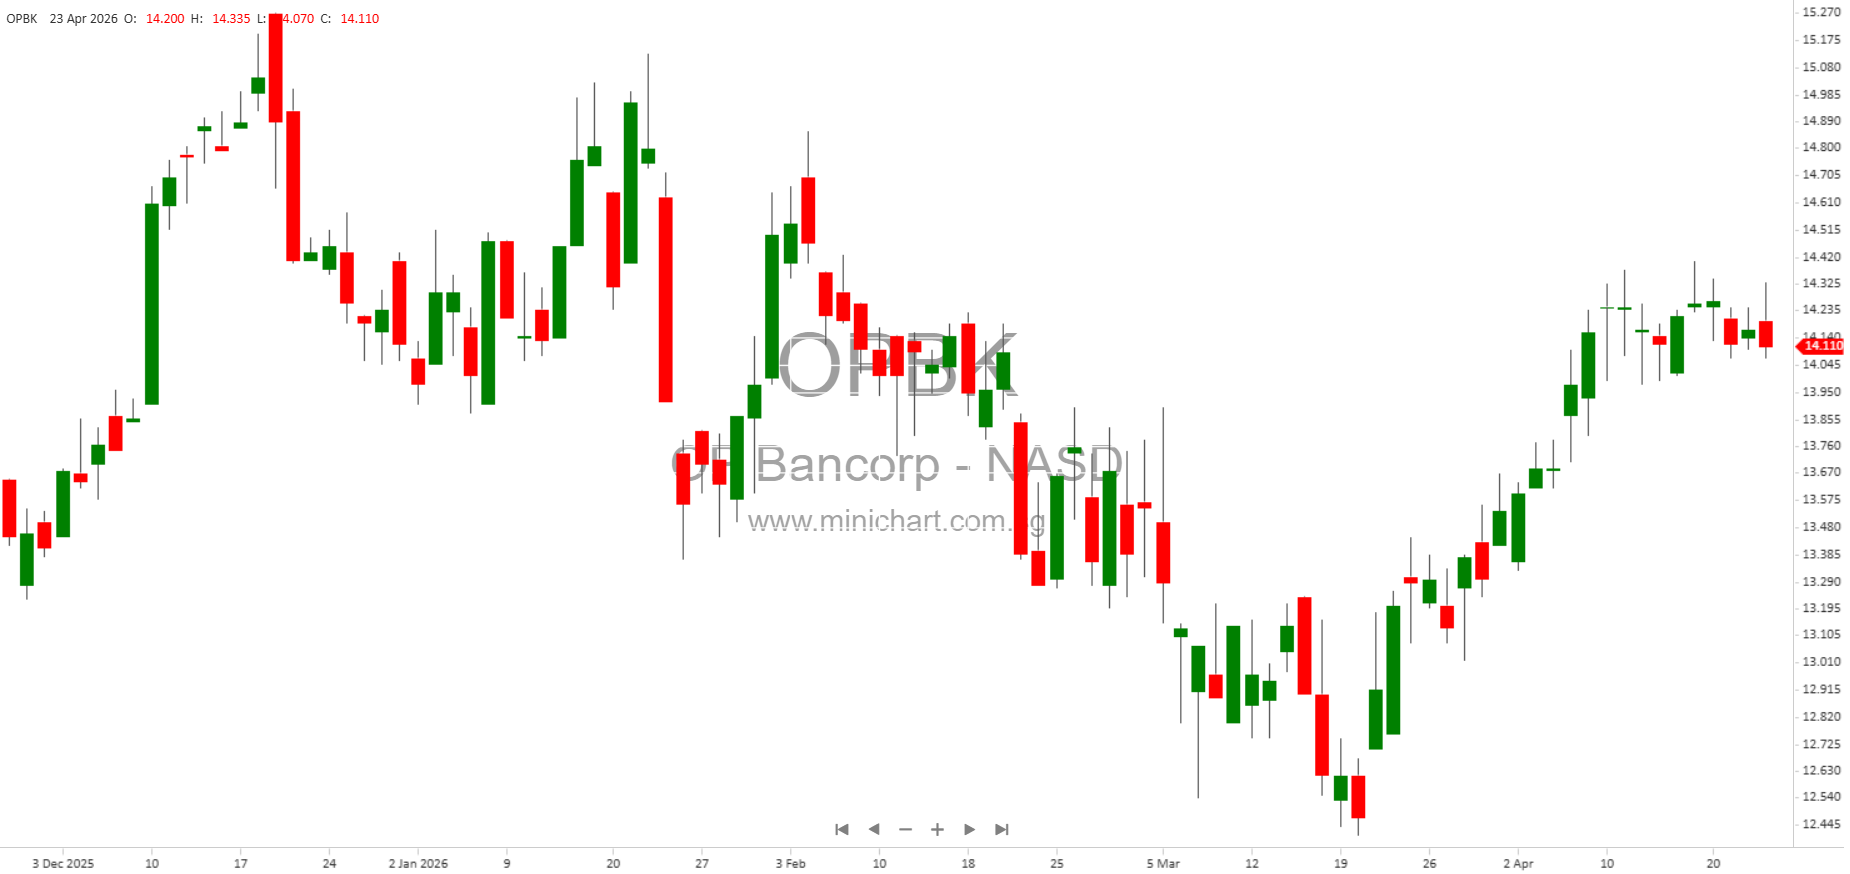
OP Bancorp (OPBK) has released its earnings presentation for the first quarter of 2026, revealing a solid performance across key financial metrics. The report contains forward-looking statements, emphasizing that future performance is subject to risks and uncertainties. Investors should carefully consider these statements, as any deviation from expected results may impact share values.
Key Financial Highlights
- Net Income: \$7.2 million for Q1 2026, up from \$7.0 million in Q4 2025.
- Diluted Earnings Per Share (EPS): \$0.48, compared to \$0.47 in Q4 2025.
- Return on Assets (ROA): 1.08% (annualized).
- Return on Equity (ROE): 12.56% (annualized).
- Net Interest Margin (NIM): 3.19%, slightly down from 3.25%.
- Efficiency Ratio: 57.97%, improved from 58.87%.
- Total Assets: \$2.70 billion, up 2% from \$2.65 billion.
- Gross Loans: \$2.23 billion, up 2% from \$2.19 billion.
- Total Deposits: \$2.33 billion, up 2% from \$2.28 billion.
- Book Value Per Common Share: Increased to \$15.62 from \$15.31.
- Quarterly Dividend: \$0.14 per share, a 17% increase from the prior dividend of \$0.12 per share.
Balance Sheet and Loan Trends
- Continued balance sheet growth, with increases across assets, loans, and deposits.
- Loan originations and portfolio composition details indicate steady growth in commercial real estate, home loans, and SBA lending.
- Commercial real estate loans (CRE) represent a significant portion of the portfolio (\$1.37 billion), diversified by property and collateral type.
- Home loan portfolio stands at \$557 million, with detailed breakdowns by loan-to-value (LTV), location, and occupancy type.
- SBA loan portfolio at \$284 million, with data on industry, location, collateral, and LTV.
Credit Quality and Capital Adequacy
- Net (Charge-offs) to Average Gross Loans: (0.01)%, improved from (0.03)%.
- Nonperforming Loans: 0.82% of gross loans, up from 0.64% in Q4 2025.
- Criticized Loans: 1.49% of gross loans, slightly higher than 1.46% previously.
- Common Equity Tier 1 (CET1) Ratio: 10.82%, confirming the bank remains well-capitalized.
Deposit and Liquidity Trends
- Growth in noninterest-bearing deposits and overall deposit composition, with continued focus on managing deposit costs and maturities.
- Total available liquidity remains robust, with significant liquid assets and borrowing capacity.
- Tier 1 leverage and total risk-based capital ratios demonstrate strong capital position.
Earnings and Profitability Details
- Noninterest income and net interest income trends support profitability.
- Efficiency ratio improvements highlight cost control efforts.
- Pre-provision net revenue and provision for loan losses are disclosed, with reconciliation to GAAP and non-GAAP measures.
- Net interest margin trends reflect prudent asset-liability management in the current rate environment.
Potential Price-Sensitive Information for Shareholders
- Dividend Increase: The 17% increase in quarterly dividend to \$0.14 per share is a positive signal, indicating management confidence and potential for shareholder returns.
- Profitability Metrics: Slight gains in net income and EPS, coupled with improved efficiency ratios and ROA/ROE, may enhance investor sentiment.
- Credit Quality: While net charge-offs improved, the rise in nonperforming loans from 0.64% to 0.82% warrants close monitoring, as further deterioration could impact future earnings.
- Balance Sheet Growth: Consistent 2% increases across assets, loans, and deposits suggest ongoing expansion and market share growth.
- Capital Adequacy: The CET1 ratio of 10.82% and increased book value per share reinforce the bank’s strength and stability.
Forward-Looking Statements and Risks
The presentation includes cautionary statements about the inherent risks and uncertainties of forward-looking statements. Readers and investors should not treat these as guarantees of future performance. Risks disclosed in the annual and SEC filings may materially impact results and share values.
Conclusion
OP Bancorp’s Q1 2026 earnings report demonstrates steady growth, improved profitability, and robust capital and liquidity positions. The notable dividend increase, combined with solid earnings and asset growth, are likely positive for shareholder value. However, the rise in nonperforming loans and ongoing market risks must be watched closely. These developments, especially the dividend hike and profitability trends, have the potential to move OPBK’s share price in the near term.
Disclaimer: This article is for informational purposes only and does not constitute investment advice. Investors should review all official filings and consult their financial advisors before making investment decisions. Past performance is not indicative of future results.