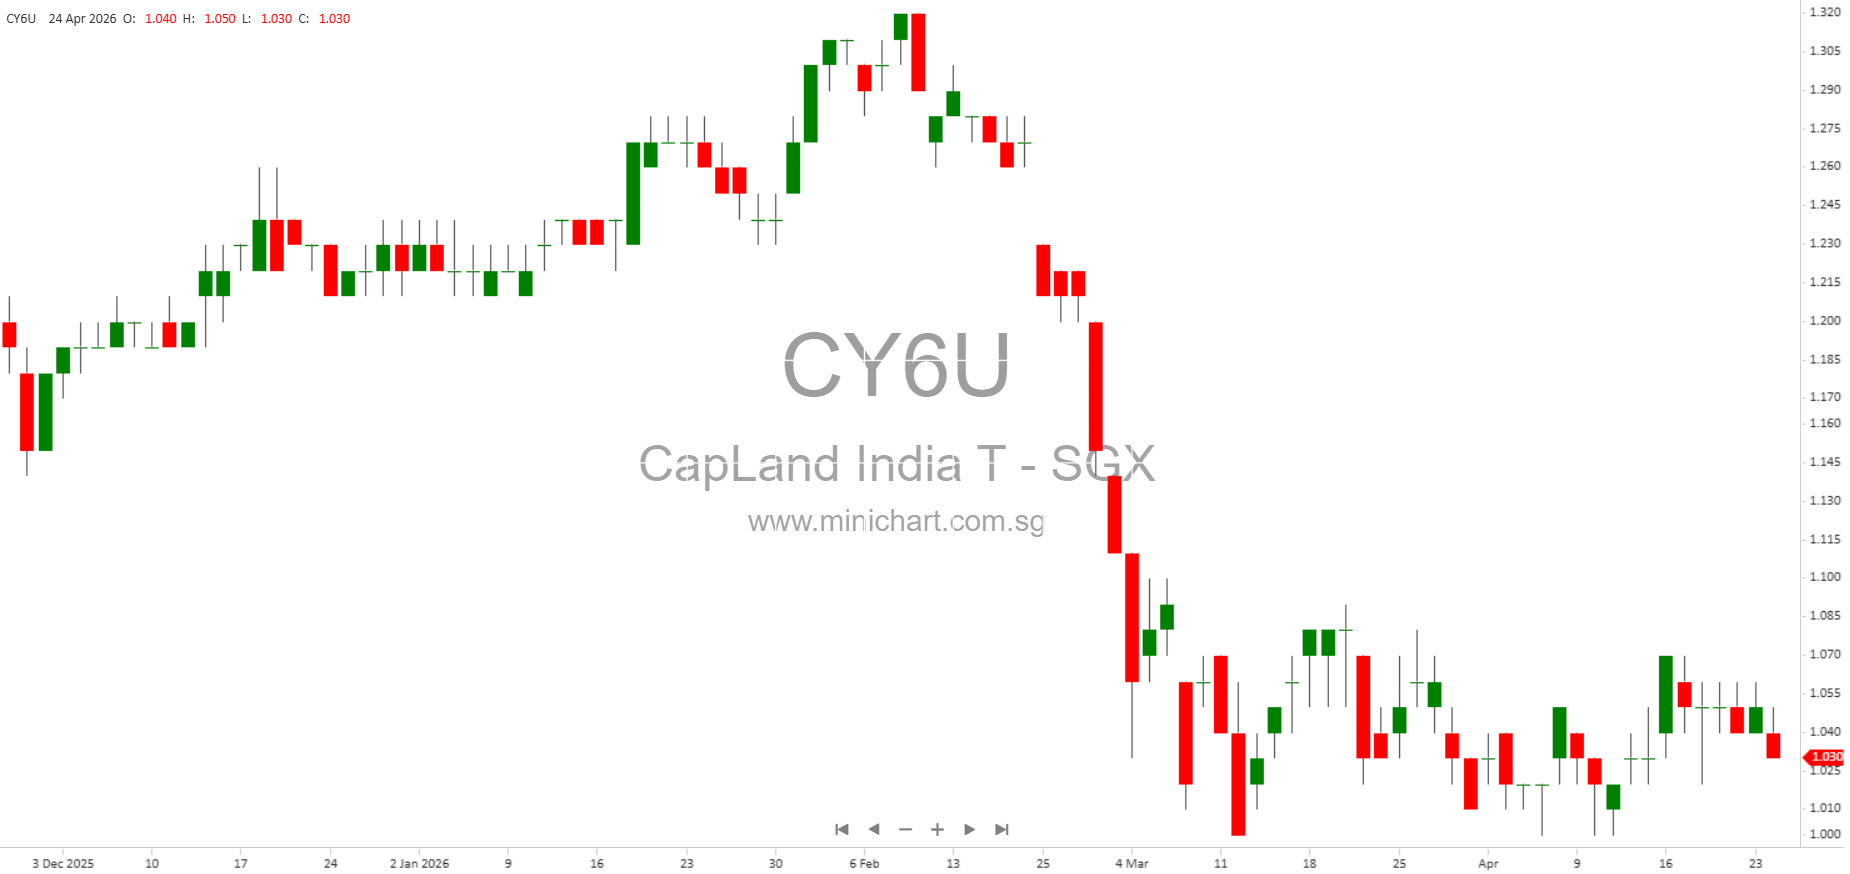
CapitaLand India Trust 1Q 2026 Business Updates: Key Highlights and Shareholder Insights
Financial Performance: Mixed Signals Amid Currency Headwinds
- Total Property Income (TPI): Recorded at S\$69.0 million, down 8% year-on-year (YoY) in SGD terms, but up 3% YoY in INR terms.
Net Property Income (NPI): S\$53.4 million, down 3% YoY in SGD, up 8% YoY in INR.
The divergence was mainly due to foreign exchange movements, highlighting the impact of INR depreciation against SGD, which could affect future distributions and share value. - Committed Occupancy: Maintained at 91%, indicating strong leasehold stability.
- Rental Reversion: Achieved a robust +17% over the trailing twelve months, signaling strong leasing momentum and potential for income growth.
- Average Cost of Debt: Increased slightly to 5.7%, reflecting a shift to more onshore INR borrowings. This move offers a natural hedge and reduces currency risk, but could impact interest expenses.
- Gearing Ratio: At 35.7%, with S\$1,284 million headroom before reaching the MAS regulatory limit of 50%, providing flexibility for future expansion or acquisitions.
- Distribution: Advanced distribution of 1.44 Singapore cents for January to March 2026 was paid on 10 April 2026. This is relevant for shareholders tracking dividend payouts.
Portfolio & Strategic Developments: Price-Sensitive Moves
- Second Long-Term Agreement Signed: With a global hyperscaler for Tower 2 of CapitaLand DC Navi Mumbai, following the first agreement for Tower 1. This signals strong demand for data centre space and recurring revenue potential.
- Divestment of Development Interests: Completed the sale of a 20.2% stake in three data centre developments on 27 February 2026.
Key Figures:- INR 7.0 billion (SGD 99.7 million) total consideration
- INR 52.0 billion (SGD 738 million) enterprise value
- 2.7x multiple on invested capital
- 13.7% premium to independent valuation
Impact: The premium and capital recycling strategy could be positive for share price and future distributions.
- Private Placement: Raised ~S\$150 million via issuance of 124.2 million new units at S\$1.208 each. The placement was oversubscribed by 2.6x, indicating strong institutional demand. Proceeds will fund forward acquisitions (MAIA and Ebisu), signaling growth ambitions.
- Growth Pipeline: Current committed developments include:
- 6 forward purchases totaling 7.3 million sq ft
- 2 IT Park developments (1.9 million sq ft)
- 3 data centre developments (200 MW gross capacity)
- Land bank of 3.7 million sq ft in Bangalore and Hyderabad
Potential Impact: These projects, once operational, will significantly enhance recurring income and asset value.
Macro Headwinds & Risk Mitigation
- Foreign Exchange Risks: The rupee’s depreciation is a key concern. 54% of debt is now in INR, with plans to increase onshore borrowings to 40-50%. Monthly forward contracts are used to hedge repatriation of income to Singapore.
- Inflation and Energy Prices: India’s rising energy costs are mitigated as 57% of CLINT’s energy supply comes from renewables, and utility costs are largely recovered from tenants. This reduces the impact on net property income.
- AI and Occupier Trends: Shift toward modular, AI-compatible office layouts and robust digital infrastructure. India’s Global Capability Centres (GCCs) are expanding their role as innovation hubs, driving record office absorption (~83 million sq ft in 2025).
Operational Review: Portfolio Quality and Tenant Diversification
- Occupancy & Lease Expiry:
- Committed occupancy at 91%
- Weighted average lease expiry: 3.3 years
- Weighted average lease term: 6.6 years
- ~50% of leases expiring in 2026 are either renewed or highly likely to be renewed
Implication: Lease stability and renewal prospects bode well for income certainty.
- Tenant Base:
- Top 10 tenants account for 39% of base rent, with Tata Consultancy Services (11%), Applied Materials (7%), Infosys (5%), UnitedHealth Group (3%), Amazon (3%), among others. Largest tenant accounts for only 11% of rent, reducing concentration risk.
- Tenant industries: IT & ITES (52%), Electronics & Engineering (15%), BFSI (8%), Healthcare & Pharma (7%), others.
- Country of origin: USA (49%), India (33%), France (3%), Singapore (2%)
- Rental Reversion: +17% overall, with strong increases in Bangalore (20%), Hyderabad (31%), Mumbai (19%), Chennai (11%). Indicates positive leasing environment and upside for future renewals.
Capital Management: Debt Profile and Funding Strategy
- Effective Borrowings: S\$1,610 million, average term to maturity: 2.7 years. 55% of borrowings are sustainability-linked, 78.5% on fixed rates, and 83.7% unsecured.
- Debt Maturity Profile: Well-spread across years, with substantial headroom for additional leverage if needed.
- Hedging Strategy: Offshore S\$ loans hedged into INR via derivatives. Semi-annual repatriation of income to Singapore with monthly forward contracts to lock in exchange rates.
- Distribution Policy: 90% of income available for distribution, 10% retained for growth flexibility.
- Equity Raising: Focused on maintaining strong balance sheet, keeping gearing at prudent levels.
Data Centre Portfolio: Growth and Capital Recycling
- CapitaLand DC Navi Mumbai: Tower 1 operational since 3Q 2025 (fully leased to a global hyperscaler). Tower 2 scheduled for completion in 4Q 2026 and also fully leased. Both towers offer strong recurring income.
- Chennai & Hyderabad Data Centres: Construction progressing, with substantial IT load and built-up area. Total project development cost at S\$1.0 billion.
- Funding Mix: Construction loans (70%), partial divestment proceeds (24%), JV partner contributions (6%).
- Capital Expenditure Requirement: ~S\$420 million for FY 2026.
Investor Takeaways & Price-Sensitive Points
- Robust leasing momentum and positive rental reversions may drive future income and distributions.
- Successful execution of forward acquisitions, data centre developments, and capital recycling (divestment at premium) could positively impact asset values and share price.
- Currency volatility remains a key risk. Management’s proactive hedging and shift toward more onshore debt may mitigate future impacts.
- Continued high occupancy, diversified tenant base, and renewal prospects support portfolio stability.
- Oversubscribed private placement signals strong market confidence and supports growth strategy.
- Expansion in data centre segment (with long-term leases to global hyperscalers) is a significant growth driver and potential rerating catalyst.
Disclaimer
This article is for informational purposes only and does not constitute investment advice, solicitation, or an offer to buy or sell securities. The analysis is based on CapitaLand India Trust’s 1Q 2026 public disclosures, which may contain forward-looking statements subject to risks and uncertainties. Actual performance and future outcomes may differ materially from those expressed or implied. Investors should conduct their own due diligence and consult professional advisors before making investment decisions.