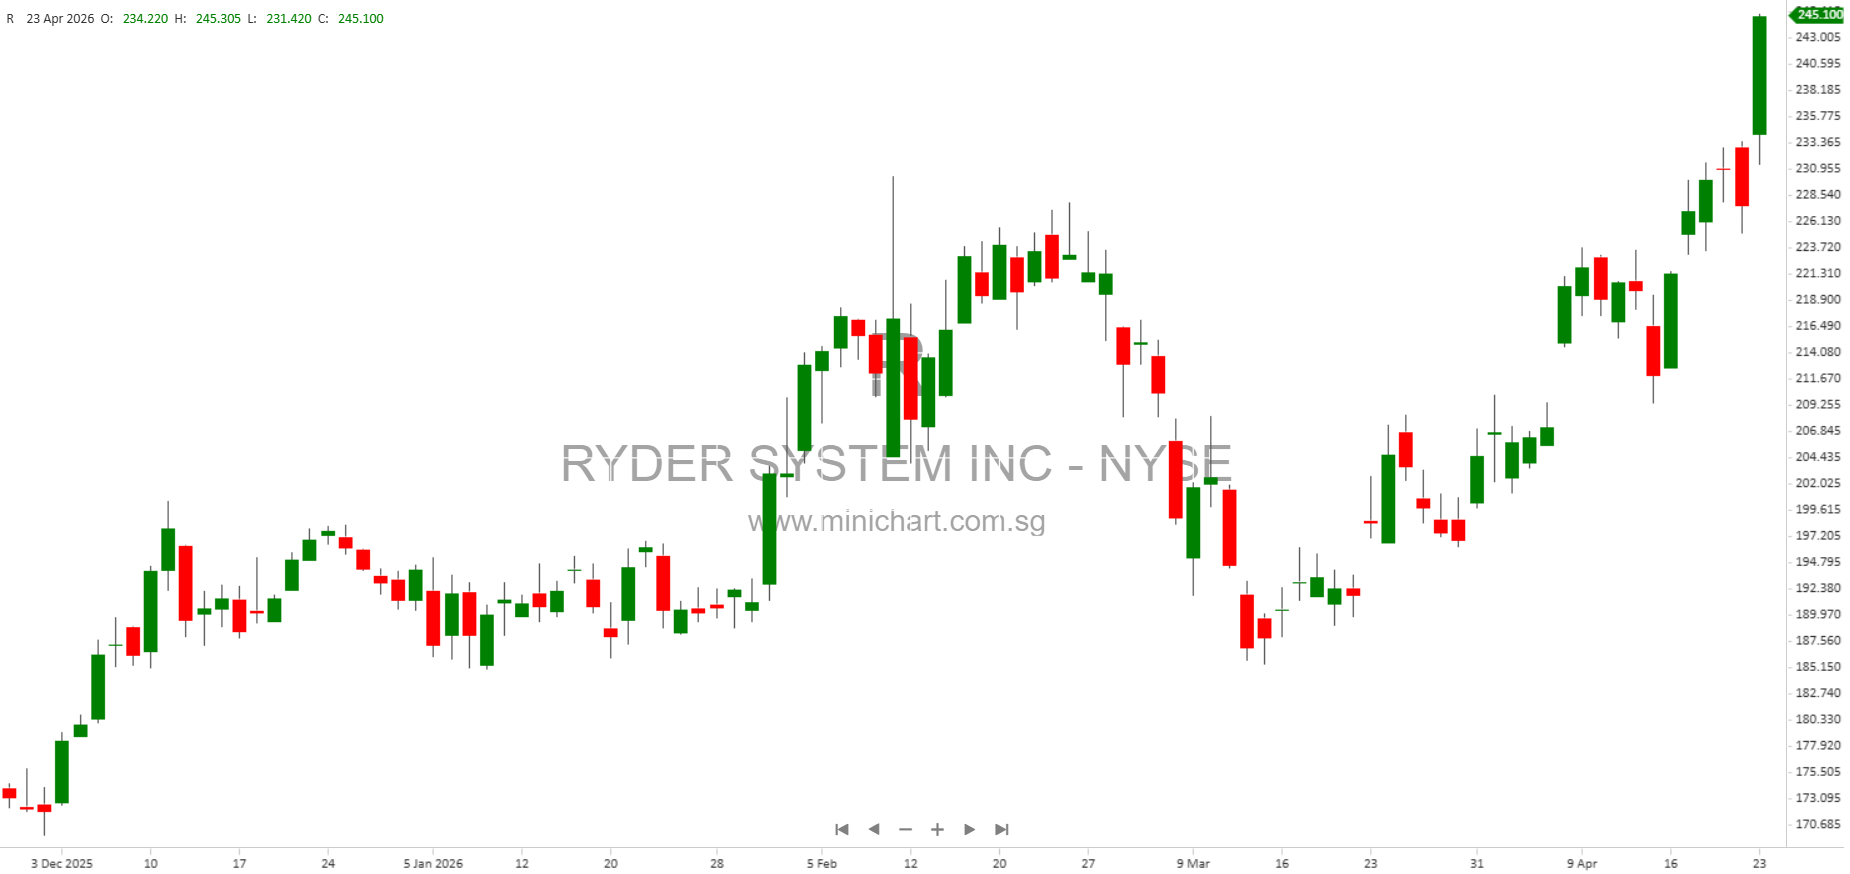
Ryder System, Inc. Reports Q1 2026 Results: Solid Performance and Upgraded Outlook
Key Highlights from Q1 2026 Results
- GAAP EPS from Continuing Operations: \$2.34, up 2% from the prior year.
- Raised Full-Year 2026 Earnings Outlook: Now projecting FY26 comparable EPS (non-GAAP) between \$14.05 and \$14.80, and free cash flow of \$700M to \$800M.
- On Track for \$70 Million in Strategic Benefits: Executing on strategic initiatives to deliver substantial cost and operational improvements.
- Segment Performance: Fleet Management Solutions (FMS) delivered earnings growth, while Dedicated Transportation Solutions (DTS) faced lower fleet counts but was partially offset by strategic execution. Supply Chain Solutions (SCS) earnings were impacted by lower automotive results and productivity ramp-up in new business.
- Capital Deployment: Strong free cash flow and capital deployment capacity, supporting both profitable growth and shareholder returns.
Detailed Financial Review
Consolidated Performance
- Total Revenue: \$3.2 billion for Q1 2026, up from \$3.1 billion in Q1 2025.
- Operating Revenue: \$2.5 billion, representing a 3% increase year-over-year.
- Earnings Before Tax (EBT): \$118 million, down from \$134 million in the prior year, primarily due to segment-specific headwinds.
- Net Earnings from Continuing Operations: \$93 million, versus \$98 million in Q1 2025.
- Free Cash Flow: \$273 million, up from \$259 million in the prior year.
- Debt-to-Equity: 269% at March 31, 2026, up from 250% at year-end 2025. This reflects ongoing capital investment and shareholder returns.
Segmental Breakdown
Fleet Management Solutions (FMS):
- Total Revenue: \$1.33 billion, up 2% year-over-year.
- Operating Revenue: \$1.0 billion, up 3%.
- EBT: \$99 million, a 6% increase from the prior year.
- EBT as % of Total Revenue: 6.8% (up 30 bps).
- Key Driver: Strong contract business performance and used vehicle sales outperformance, offsetting challenging market conditions.
Supply Chain Solutions (SCS):
- Total Revenue: \$1.04 billion, flat year-over-year.
- Operating Revenue: \$874 million, unchanged.
- EBT: \$72 million, down 17% from \$87 million in Q1 2025.
- EBT as % of Total Revenue: 5.3%, down from 6.7%.
- Key Issues: Earnings impacted by lower automotive sector results and lower productivity from new business ramp-up. The prior year’s quarter was a record, amplifying the comparative decline.
Dedicated Transportation Solutions (DTS):
- Total Revenue: \$656 million, down 5% year-over-year.
- Operating Revenue: \$623 million, down 4%.
- EBT: \$27 million, down 15%.
- EBT as % of Total Revenue: 4.2%, down from 4.7%.
- Key Factors: Lower fleet counts, partially offset by execution on strategic initiatives. Year-over-year comparison reflects a record quarter in the prior year.
Updated 2026 Full-Year Outlook
- Total Revenue Growth: Targeting 3% for FY26.
- Operating Revenue Growth (non-GAAP): Also anticipated at 3%.
- Comparable EPS (non-GAAP): \$14.05 to \$14.80, revised upward.
- Return on Equity (ROE, non-GAAP): 17% – 18%.
- Free Cash Flow (non-GAAP): \$700 million to \$800 million.
- Capital Expenditures: \$2.4 billion, reflecting continued investment in growth and fleet renewal.
- Debt-to-Equity: 230% forecast by year-end.
- Q2 2026 EPS Guidance: GAAP EPS expected at \$3.20 – \$3.45; Comparable EPS (non-GAAP) at \$3.50 – \$3.75.
CEO Commentary
“The Ryder team delivered solid first quarter results that exceeded our expectations. Outperformance was driven by used vehicle sales results in FMS. Our results continue to demonstrate the earnings power and resiliency of our transformed business model. We are executing effectively on our strategic initiatives, and our strong free cash flow and capital deployment capacity enable us to fund profitable growth while returning capital to shareholders.”
— John Diez, Chief Executive Officer
Shareholder Considerations and Price-Sensitive Information
- Raised Guidance: The increase in full-year comparable EPS and free cash flow outlook is a significant positive development. It signals management’s confidence in sustainable earnings growth, which may be positively received by the market.
- Segment Dynamics: While FMS is performing above expectations, SCS and DTS are facing headwinds, particularly from the automotive sector and lower fleet counts. Investors should monitor these segments for signs of stabilization or recovery.
- Capital Allocation: Continued high capital expenditures and an elevated debt-to-equity ratio may raise questions about leverage and risk; however, these are balanced by robust free cash flow generation and clear commitment to shareholder returns.
- Strategic Initiatives: The company remains on track to deliver \$70 million in benefits from ongoing strategic projects in 2026, which could further enhance profitability.
- Dividend and Buyback Potential: While not specifically mentioned, the strong free cash flow and capital deployment suggest potential for continued or increased shareholder distributions.
Forward-Looking Statements and Non-GAAP Measures Notice
This release includes “forward-looking statements” under the Private Securities Litigation Reform Act of 1995. Such statements involve risks and uncertainties, including but not limited to market conditions, ability to execute strategic initiatives, segment performance, capital allocation, and other factors detailed in SEC filings. Actual results may differ materially. This report also includes certain non-GAAP financial measures—see the company’s website and SEC filings for reconciliations to the most comparable GAAP measures.
Contacts
- Media: Amy Federman
- Investor Relations: Calene Candela
For more details, including the full press release, webcast replay, and presentation, visit https://investors.ryder.com.
Disclaimer: This article is for informational purposes only and is not investment advice. All data and statements are based on the latest Ryder System, Inc. SEC filings and company disclosures. Investors should consult official filings and their financial advisors before making investment decisions. The author assumes no responsibility for investment actions taken based on this summary.