Helen of Troy Limited Announces Fiscal 2026 Results and Strategic Shift for Fiscal 2027
Executive Summary
- Fiscal 2026 consolidated net sales: \$1.786 billion (down 6.4% from \$1.908 billion in Fiscal 2025)
- Fourth quarter net sales: \$470.0 million (down 3.3% YoY)
- GAAP diluted loss per share: \$(39.08) for the year, \$(2.41) for Q4 (vs. earnings per share of \$5.37 and \$2.22 respectively in prior year)
- Non-GAAP adjusted diluted EPS: \$3.55 for the year, \$0.83 for Q4 (vs. \$7.17 and \$2.33 in prior year)
- Non-GAAP adjusted EBITDA margin: 10.4% for year, 10.3% for Q4 (vs. 15.2% and 17.4%)
- Free cash flow: \$131.9 million for FY26 (up from \$83.1 million)
- Asset impairment charges: \$885.9 million for FY26, \$79.2 million for Q4
- Fiscal 2027 outlook: Net sales of \$1.751-\$1.822 billion, GAAP diluted EPS of \$3.57-\$4.18, adjusted EPS \$3.25-\$3.75, adjusted EBITDA \$190-\$197 million, free cash flow \$85-\$100 million
Detailed Financial Results
Fourth Quarter Fiscal 2026 vs. Fiscal 2025
- Net sales revenue fell 3.3% to \$470.0 million, driven by declines in Beauty & Wellness (fans, prestige hair care, humidifiers, air purifiers) and Home & Outdoor (insulated beverageware, home categories). Partially offset by strong demand for technical, travel, lifestyle packs, increased thermometer sales, and Olive & June organic growth.
- Gross profit margin decreased 400 basis points to 44.6% (impacted by higher tariffs, inventory obsolescence, promotional expense, channel mix).
- SG&A ratio increased 270 basis points to 38.6% (driven by higher incentive compensation, EPA compliance costs of \$4.4 million, Olive & June acquisition, unfavorable operating leverage).
- Asset impairment charges were substantial: \$79.2 million in Q4, mainly due to the sustained decline in share price.
- Operating loss of \$51.0 million vs. income of \$2.0 million in prior year.
- Interest expense slightly decreased to \$13.9 million.
- Income tax benefit dropped to \$9.0 million from \$62.5 million prior year, due to fewer transitional benefits and resolution of uncertain tax positions.
- Net loss of \$55.6 million, compared to net income of \$50.9 million prior year.
- Adjusted operating income fell 47.7% to \$39.2 million (8.3% margin).
- Adjusted EBITDA fell 42.5% to \$48.5 million (margin 10.3%).
- Adjusted diluted EPS dropped 64.4% to \$0.83.
Full Fiscal Year 2026 vs. Fiscal 2025
- Net sales revenue fell 6.4% to \$1.786 billion.
- Gross profit margin decreased to 45.7% from 47.9%.
- Operating margin plummeted to (43.8)% from 7.5%, driven by huge non-cash asset impairment charges (49.6% margin impact).
- Adjusted operating margin dropped to 8.3% from 13.2%.
- GAAP diluted loss per share was \$(39.08) vs. earnings per share of \$5.37.
- Adjusted diluted EPS \$3.55 vs. \$7.17.
- Free cash flow improved to \$131.9 million vs. \$83.1 million.
Segment Results
Home & Outdoor
- Net sales fell 1.5% to \$216.5 million (Q4).
- Operating income dropped to \$16.7 million (7.7% margin), with asset impairment charges of \$3.9 million.
- Adjusted operating margin fell to 10.4% (from 17.9%).
- Factors: Continued competition, softer consumer demand, unfavorable seasonal placement, decrease in online channel sales due to retailer pull-forward activity (tariff uncertainty prior year).
Beauty & Wellness
- Net sales fell 4.7% to \$253.5 million (Q4).
- Operating loss widened to \$67.7 million ((26.7)% margin), with asset impairment charges of \$75.2 million.
- Adjusted operating margin dropped to 6.6% (from 13.4%).
- Factors: Stop shipment actions, price increases, lower replenishment orders, softer demand, increased competition, below average illness season, EPA compliance costs (\$4.4 million).
Balance Sheet and Cash Flow
- Cash and cash equivalents stable at \$18.9 million.
- Inventory at \$455.8 million (including ~\$34 million higher tariff costs).
- Total debt reduced to \$780.8 million from \$916.9 million.
- Accounts receivable turnover slightly increased to 72.1 days.
- Net cash provided by operating activities: \$171.1 million (up from \$113.2 million).
- Free cash flow: \$131.9 million (up from \$83.1 million).
- Fiscal 2026 included ~\$72 million cash outflow for higher tariff payments.
Subsequent Event: Sale of Distribution Facility
- On April 14, 2026, Helen of Troy completed the sale of its Southaven, Mississippi distribution facility for \$82 million (net proceeds \$78.2 million after costs).
- Recognized a gain of \$54.9 million in Q1 FY27, credited to Beauty & Wellness segment.
- Proceeds used to repay debt under credit facility.
Fiscal 2027 Annual Outlook
- Consolidated Net Sales: \$1.751-\$1.822 billion
- Home & Outdoor Net Sales: \$854-\$882 million
- Beauty & Wellness Net Sales: \$897-\$940 million
- GAAP Diluted EPS: \$3.57-\$4.18
- Adjusted Diluted EPS: \$3.25-\$3.75
- Net Income (GAAP): \$83-\$97 million
- Adjusted EBITDA: \$190-\$197 million
- Operating Cash Flow: \$117-\$128 million
- Free Cash Flow: \$85-\$100 million
- Interest Expense: \$47-\$49 million; net leverage ratio expected to reduce to ~3.2x or lower by FY27 end.
- Capital Expenditures: \$28-\$32 million, focused on product innovation and supply chain diversification.
- Tariffs: Assumes current tariffs remain, with China exposure reduced to 15%-20% by FY27 year-end.
- Adjusted tax rate: 25.0%-27.0%
- Shares outstanding: 23.3 million diluted average.
Strategic and Macro Environment Highlights
- Shift to growth-first mindset: CEO emphasizes pivot from stabilization to prioritizing growth and shareholder value creation.
- Ongoing inflationary pressures, softness in discretionary categories, conservative retailer inventory management, competitive and promotional landscape expected to persist.
- Geopolitical and supply chain risks: Ongoing conflict with Iran and other disruptions could affect energy, commodity costs, and supply chain continuity, though not assumed as significant in the outlook.
- Tariff mitigation: Helen of Troy continues to diversify manufacturing footprint, aiming to reduce China tariff exposure and limit operating income impact to less than \$10 million for FY27.
- Increase in growth investments: 40 basis points increase in high-return marketing and innovation initiatives.
Key Risks and Forward-Looking Statements
- Material risks include: distribution facility concentration, cyber threats, reliance on licensed trademarks, customer concentration, third-party manufacturing in Asia, trade barriers, supply chain disruptions, economic downturns, weather and illness seasonality, CEO succession, realization of synergies from acquisitions/divestitures, regulatory changes, environmental and privacy compliance, product recalls, tax changes, and volatility in capital markets.
- Forward-looking statements are subject to risks and uncertainties and may differ materially from actual results.
Potential Price Sensitive News and Investor Takeaways
- Large asset impairment charges (\$885.9 million FY26) and significant GAAP losses may impact investor sentiment and share price.
- Sale of distribution facility and debt reduction, along with improved free cash flow, signal balance sheet strengthening.
- Strategic shift to “growth-first” mindset and increased growth investments could drive future performance.
- Fiscal 2027 outlook indicates return to profitability and stabilization after a challenging FY26.
- Ongoing tariff, supply chain, and geopolitical risks remain unpredictable and could materially affect results.
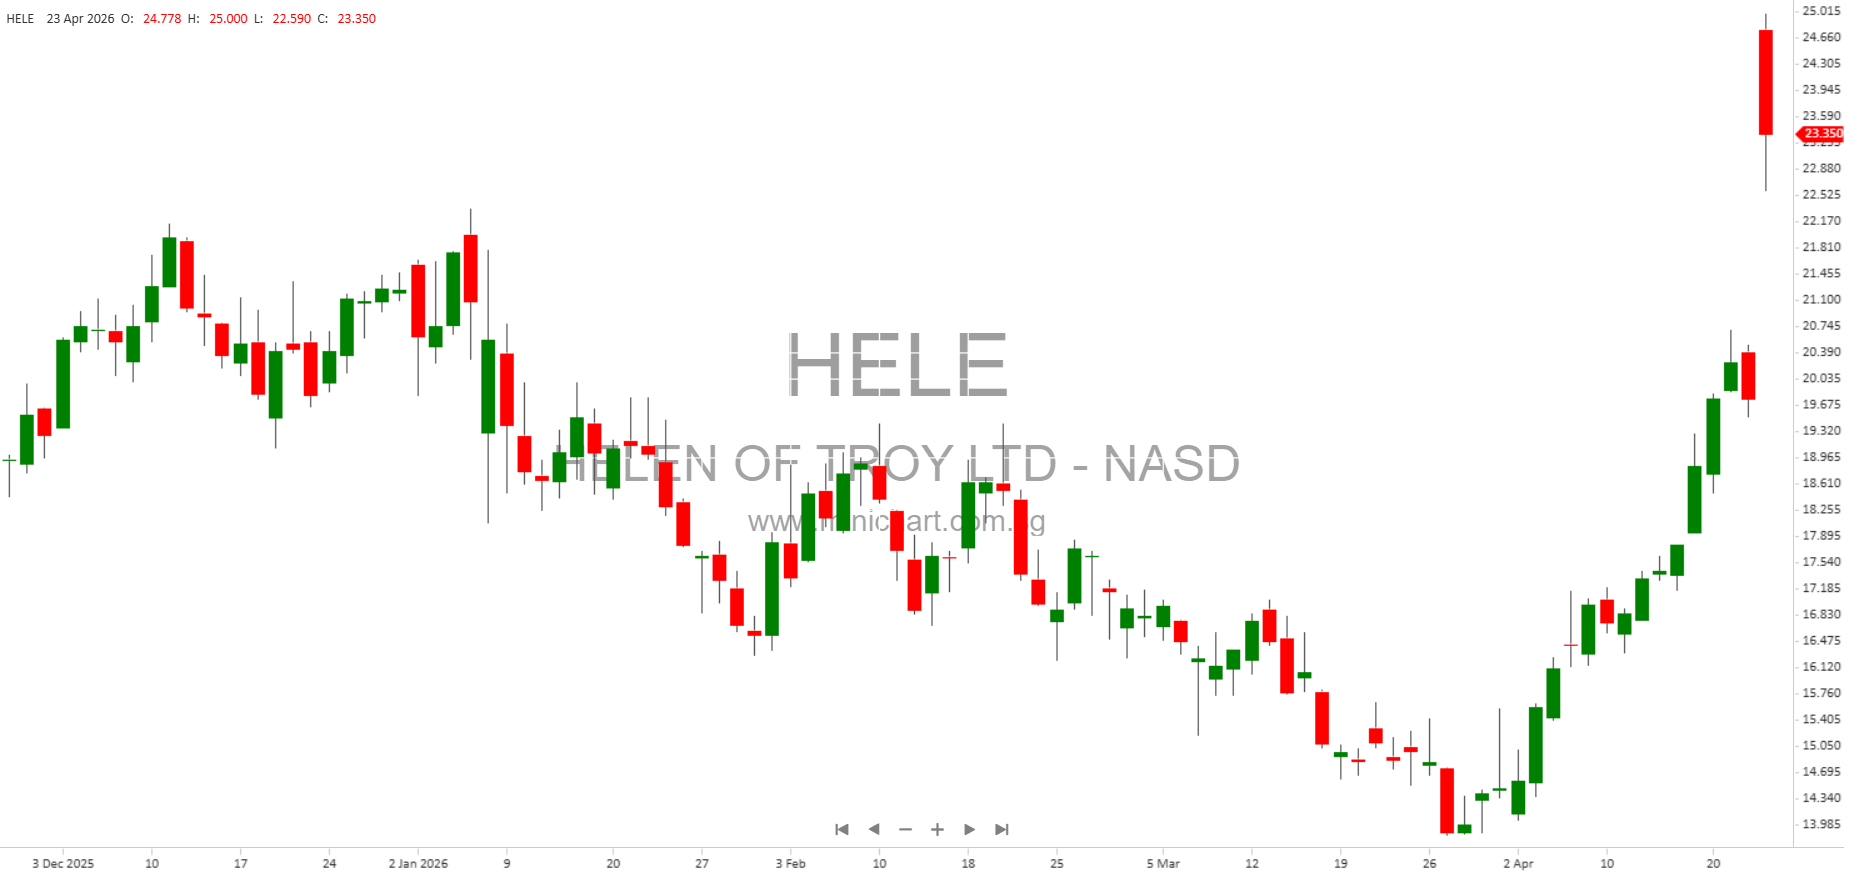
About Helen of Troy Limited
Helen of Troy Limited (NASDAQ: HELE) is a global consumer products company with a diverse portfolio of well-known brands including OXO, Hydro Flask, Osprey, Vicks, Braun, Honeywell, PUR, Hot Tools, Drybar, Curlsmith, Revlon, and Olive & June.
Disclaimer
This article is for informational purposes only and does not constitute financial advice or a recommendation to buy or sell any securities. Forward-looking statements are subject to risks and uncertainties that may cause actual results to differ materially. Investors should review Helen of Troy’s SEC filings and consult their own financial advisors before making investment decisions.