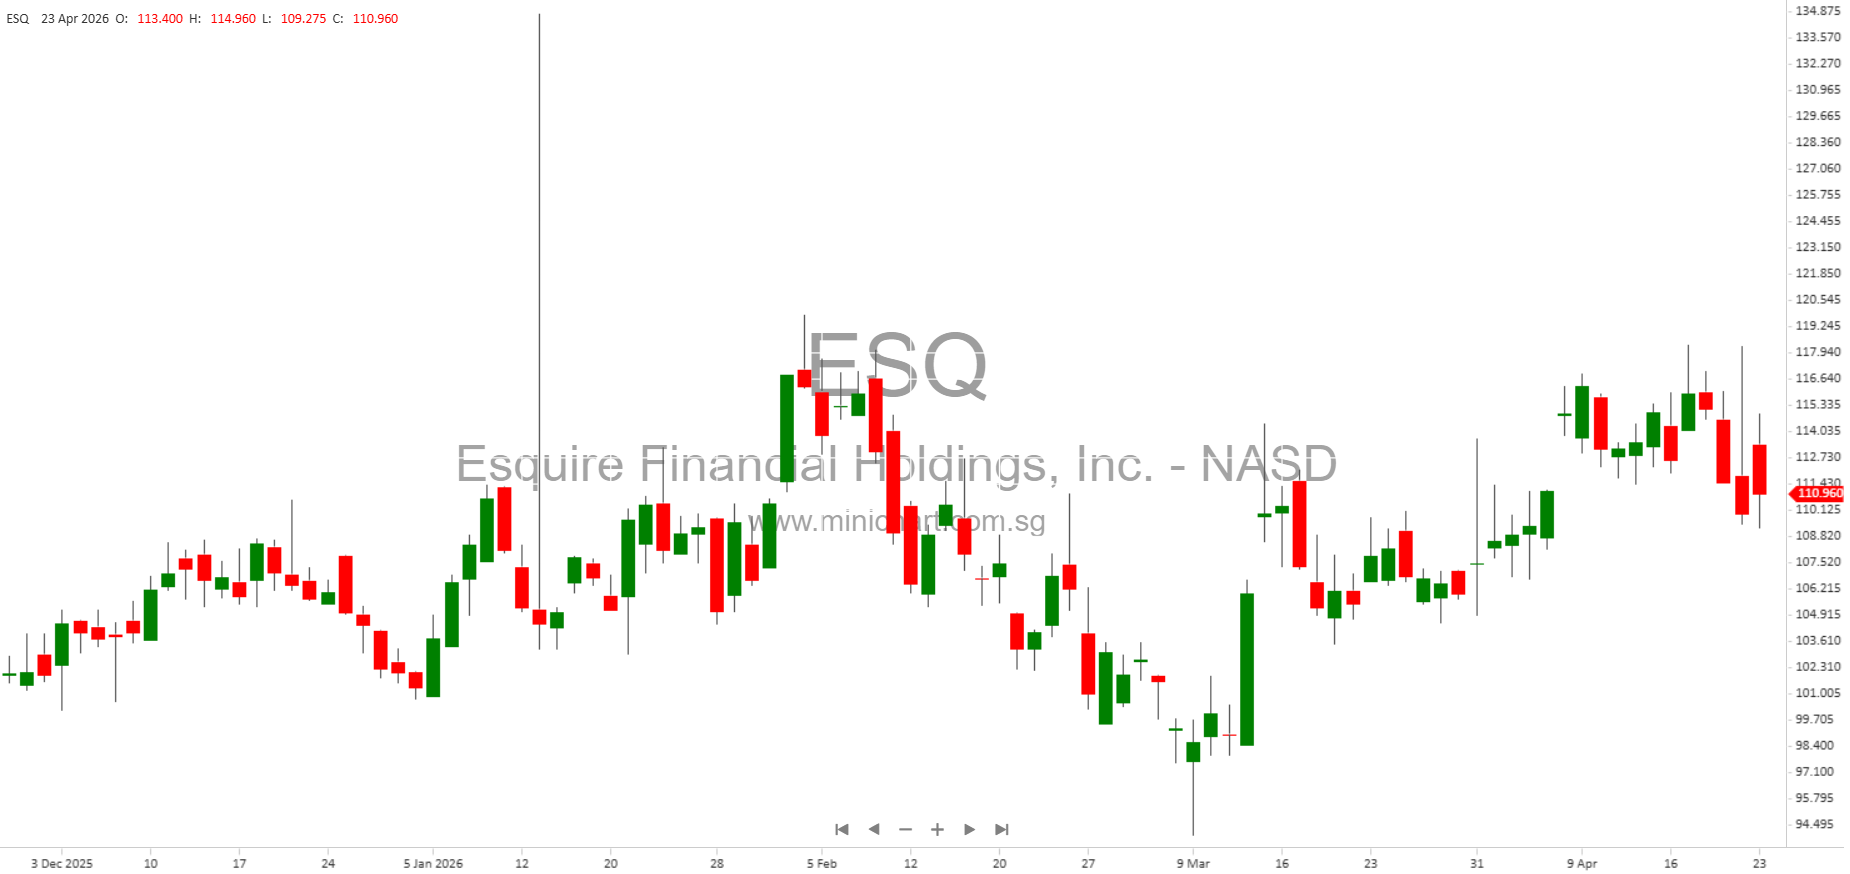
Esquire Financial Holdings, Inc. Delivers Strong Q1 2026 Results and Advances Signature Bancorporation Acquisition
Key Highlights from Q1 2026
- Net Income Growth: Net income rose 7.0% to \$12.2 million (\$1.40 per diluted share), compared to \$11.4 million (\$1.33 per diluted share) in Q1 2025, despite \$1.7 million in elevated pre-tax noninterest expense related to merger costs and board member departures.
- Adjusted Earnings: Excluding one-off expenses, adjusted net income was \$13.8 million (\$1.58 per diluted share).
- Industry-Leading Returns: Return on average assets and equity were 2.10% and 16.82%, respectively. On an adjusted basis, these increased to 2.37% and 18.96%.
- Net Interest Margin: A robust margin of 6.04% was supported by national litigation platform growth, despite declines in short-term interest rates.
- Loan and Deposit Growth: Loans rose \$399.2 million year-on-year to \$1.82 billion, with litigation-related commercial loans growing 46.3%. Total deposits increased \$414.4 million to \$2.10 billion.
- Strong Credit Metrics: Allowance for credit losses to loans ratio at 1.30%, with only one nonperforming loan (\$736k) and no exposure to office/construction loans.
- Efficiency and Dividend: Efficiency ratio at 51.1% (46.9% adjusted). Cash dividend raised 14% to \$0.20 per share – fifth consecutive increase since 2022.
- Strategic Acquisition: Integration of Signature Bancorporation, Inc. progressing, with regulatory and SEC filings completed.
- Recognition: Named one of the nation’s top-performing community banks by S&P Global Market Intelligence for the second consecutive year; also named a top 10 merchant acquiring bank by Nilson Report.
Comprehensive Operational and Financial Review
1. Earnings and Adjusted Performance
Esquire Financial Holdings, Inc. reported a solid increase in profitability for Q1 2026, achieving \$12.2 million in net income (\$1.40 per diluted share), up from \$11.4 million (\$1.33 per share) in the previous year. Adjusting for \$1.6 million in after-tax noninterest expenses linked to merger activities and board member departures, net income would have been \$13.8 million (\$1.58 per share). These results reflect continued investment in growth and client service, and robust performance despite sector headwinds.
2. Balance Sheet Strength and Growth
- Total assets: Up 23.9% to \$2.42 billion.
- Loans: Up 28.2% year-on-year, driven by \$386.9 million growth in litigation-related commercial loans, which now total \$1.22 billion.
- Deposits: Up 24.6% to \$2.10 billion, with growth in escrow/IOLTA, commercial money market, and demand deposits. 55.8% of deposits are longer-duration IOLTA, escrow, and settlement funds.
- Off-Balance Sheet Sweep Funds: \$1.0 billion, with \$330 million available for on-balance liquidity; \$1.1 million in ASP fee income for the quarter.
- Liquidity: Additional available liquidity of \$522 million, excluding cash, sweep funds, and unsecured borrowing capacity.
3. Asset Quality and Risk Management
Credit metrics remain outstanding. Allowance for credit losses is at 1.30% of loans, with only one nonperforming loan (\$736k; 0.03% of assets). During the quarter, Esquire foreclosed on a \$7.8 million nonaccrual multifamily loan, recorded a \$3.2 million charge-off, and sold the collateral. No exposure to office or construction loans, and only \$13.9 million in performing hospitality loans. Commercial real estate portfolio has a weighted average DSCR of 1.61 and original LTV of 56% – indicating prudent underwriting and low risk.
4. Efficiency and Noninterest Items
- Efficiency Ratio: 51.1% overall, dropping to an impressive 46.9% after adjusting for one-time expenses.
- Noninterest Income: \$6.5 million, led by \$5.1 million in payment processing fees. Payments platform processed \$9.7 billion in credit/debit volume (4.6% increase, 137.3 million transactions), serving 93,000 small business clients nationwide.
- Noninterest Expense: Increased to \$20.7 million, up 23.3%, due to higher compensation (linked to performance and growth), merger costs, technology investments, marketing, and new branch operations (Los Angeles).
5. Capital and Dividend Policy
- Capital Ratios: Common Equity Tier 1 (CET1) at 14.25%, Tangible Common Equity to Assets at 12.44% – well above regulatory requirements.
- Dividend: Regular quarterly cash dividend increased by 14% to \$0.20 per share, the fifth consecutive increase since the program began in 2022.
6. Merger with Signature Bancorporation, Inc.
The planned acquisition of Signature Bancorporation (parent of Signature Bank, Chicago) is advancing, with all necessary regulatory and SEC filings submitted. An external advisory firm has been engaged for integration, and joint planning sessions are ongoing. This strategic move is expected to provide Esquire with a major presence in the Chicago metro area, complementing its foothold in New York and Los Angeles – the top three U.S. markets for contingent fee law firms. The integration is expected to deliver accelerated growth and expanded market opportunities.
Potentially Price-Sensitive Information for Shareholders
- Signature Bancorporation Merger: The merger, once closed and successfully integrated, is expected to further boost growth and market presence. Any delays or integration issues could impact the share price.
- Dividend Increase: The 14% increase in the quarterly dividend signals management’s confidence in ongoing earnings and capital strength.
- Consistent Industry-Leading Metrics: Sustained high returns on assets and equity, combined with strong asset quality, may continue to attract institutional interest and support valuation multiples.
- Tech-Driven Payment Growth: Esquire’s growing payments business, strong merchant base, and national litigation vertical provide significant fee income and growth potential.
- Prudent Credit Management: Minimal nonperforming loans and no exposure to riskier real estate sectors (office, construction) are a defensive positive in a challenging macro environment.
Additional Details and Guidance
- Tax Rate: The effective tax rate rose to 28.6% from 26.5% due to non-deductible merger-related costs.
- Adjusted Metrics: All key operating metrics (earnings, ROA, ROE, efficiency, EPS) improved meaningfully on an adjusted basis, excluding merger and board departure costs.
- Low Cost of Funds: Cost of deposits held steady at 1.00%, reflecting a high proportion of noninterest and low-cost commercial relationship funds.
- Capital Adequacy: All regulatory capital ratios remain well above minimums, providing flexibility for growth and strategic initiatives.
Outlook
Esquire Financial Holdings is well-positioned for continued profitable growth, with a strong balance sheet, industry-leading profitability, expanding national presence, and prudent risk management. The successful integration of Signature Bancorporation is a key catalyst for 2026 and beyond, and management has reiterated its focus on seamless execution and continued investment in technology and people to drive future performance.
Disclaimer
This article is for informational purposes only and does not constitute investment advice or a recommendation to buy or sell any security. Forward-looking statements are subject to risks and uncertainties, including those described in Esquire Financial Holdings, Inc.’s SEC filings. Actual results may differ materially from those projected. Readers should conduct their own due diligence and consult with financial advisors before making investment decisions.