American Airlines Reports Record First-Quarter 2026 Revenue but Posts Net Loss; Maintains Flat Full-Year Outlook Amid Higher Jet Fuel Costs
Key Highlights for Investors
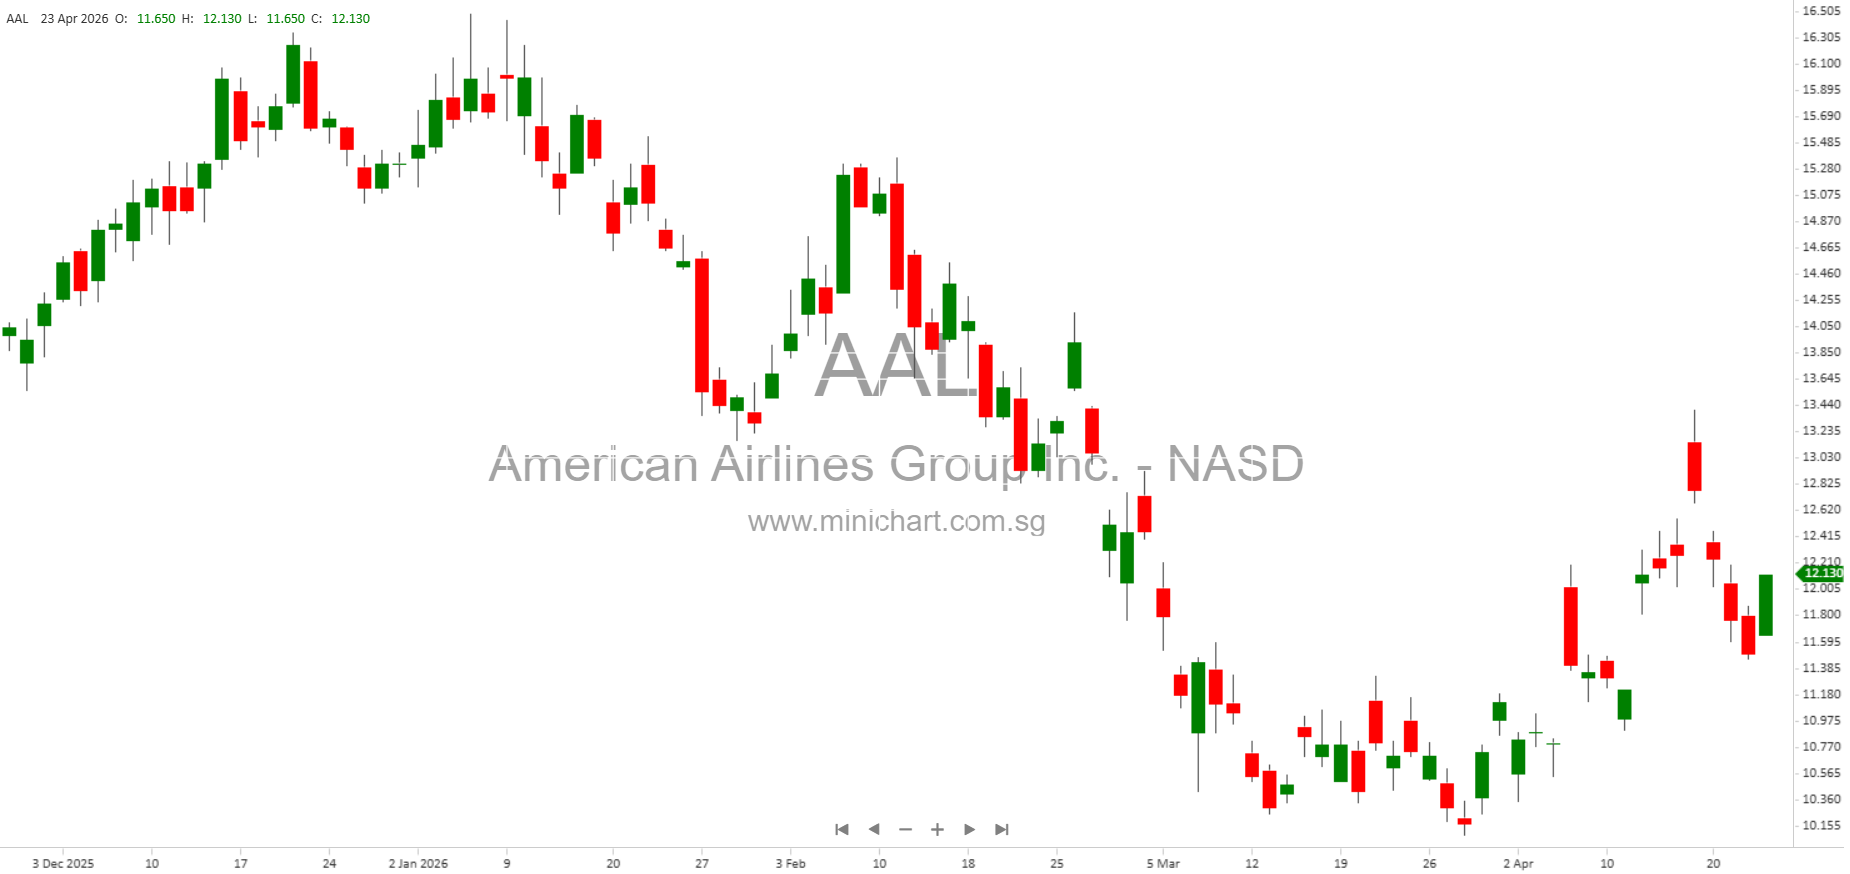
- Record First-Quarter Revenue: American Airlines Group Inc. (NASDAQ: AAL) delivered its highest-ever Q1 revenue at \$13.9 billion, a 10.8% increase year-over-year, despite a \$320 million hit from severe winter storms.
- Net Loss Narrowed: The company posted a GAAP net loss of \$382 million (or (\$0.58) per diluted share), compared to a \$473 million loss in Q1 2025. Excluding special items, the net loss was \$267 million (or (\$0.40) per share).
- Debt Reduction: Ended the quarter with total debt at \$34.7 billion, marking the lowest level since mid-2015.
- Guidance & Outlook: Second-quarter 2026 adjusted EPS expected between (\$0.20) and \$0.20. Full-year 2026 earnings guidance is approximately flat vs. 2025, despite a more than \$4 billion increase in jet fuel expense.
- Liquidity: Ended the quarter with \$10.8 billion in liquidity and over \$27 billion in unencumbered assets and borrowing capacity.
- Operational Improvements & Customer Experience: Notable investments in premium lounges, significant growth in premium seating, and rollout of free high-speed satellite Wi-Fi for AAdvantage® members.
- Strong Demand: Nine highest revenue intake weeks in company history during Q1; March passenger unit revenue up over 10% YoY domestic and international.
- Premium Revenue & Loyalty: 13% YoY growth in managed corporate revenue, record co-branded credit card spend (+9%), and 25% YoY increase in new AAdvantage® enrollments.
- CASM (Cost Per ASM): Operating cost per ASM excluding special items, fuel, and profit sharing rose 5.2% YoY to 15.29 cents.
- Shareholder Equity: Company remains in an equity deficit position at (\$4.1 billion).
Detailed Financial Performance
- Operating Revenues: Passenger revenue reached \$12.5 billion (+9.7% YoY), cargo revenue \$214 million (+12.9%), and other revenue \$1.2 billion (+23.9%).
- Operating Expenses: Aircraft fuel and related taxes increased 13.2% YoY to \$2.93 billion, averaging \$2.75/gallon (+10.7%). Salaries, wages, and benefits rose 10.7% to \$4.67 billion.
- Operating Loss: Narrowed to \$41 million from \$270 million in Q1 2025, demonstrating margin improvement despite higher fuel costs.
- Non-Operating Expenses: Interest expense, net, was \$397 million, a 7.3% YoY decrease. Other expenses increased significantly to \$93 million, primarily due to mark-to-market equity adjustments and debt refinancing charges.
- Cash Flows: Net cash provided by operating activities was \$4.2 billion (up from \$2.5 billion), and free cash flow reached \$3.4 billion after adjusting for investments and short-term asset changes.
- Balance Sheet: Cash and short-term investments combined totaled \$7.3 billion. Total assets grew to \$63.7 billion. Total liabilities, including debt and lease obligations, stand at \$67.8 billion.
Operational Metrics & Network Developments
- Available Seat Miles (ASM): Up 3.0% YoY to 72.0 billion in Q1. Passenger load factor improved to 81.3% (+0.7 pts).
- Unit Revenues: Total revenue per ASM up 7.6% YoY to 19.32 cents.
- Segment Performance:
- Domestic: Revenue passenger miles up 3.9%, passenger revenue up 10.6%.
- Atlantic: Passenger unit revenue up an impressive 16.7% YoY; revenue up 14.2%.
- Pacific: Load factor at 84.8% (+2.0 pts), revenue up 12.1%.
- Capacity Expansion: Aircraft fleet increased to 1,594 (mainline + regional), with ongoing investments in premium seating and network expansion at key hubs, including Chicago, Miami, Dallas, and Philadelphia.
Strategic Initiatives & Customer-Focused Investments
- Customer Experience: Substantial upgrades to Flagship® and Admirals Club® lounges at major airports. Free high-speed Wi-Fi (sponsored by AT&T) now available on more aircraft than any other carrier globally.
- Technology & App Improvements: Enhanced digital app with real-time notifications and self-service rebooking features.
- Loyalty Program: Record AAdvantage® enrollments (+25%) and co-branded credit card spend (+9%) following expanded Citi partnership.
- Schedule & Network: Strengthened operational reliability through rebanking at Dallas/Fort Worth and Philadelphia, and multi-year infrastructure investment in Miami to support Latin America operations.
Guidance and Forward Outlook
- Q2 2026 Guidance: Available seat miles expected to rise 4-6%, total revenue to increase 13.5-16.5% YoY, CASM ex-fuel up 2-4%, and adjusted EPS between (\$0.20) and \$0.20.
- Full-Year 2026 Outlook: Adjusted EPS between (\$0.40) and \$1.10, with the midpoint flat vs. 2025 despite a >\$4 billion rise in jet fuel costs.
- Risks Highlighted: The company notes ongoing risks from high debt levels, competitive pressures, labor relations, fuel price volatility, cybersecurity, regulatory changes, and macroeconomic/geopolitical instability. These could impact liquidity, margins, and overall results.
Shareholder Considerations & Potential Price Movers
- Revenue Momentum vs. Cost Pressures: Record revenues and improving margins are positive, but sustained high jet fuel costs and a flat profit outlook may limit near-term upside unless cost containment or further pricing power emerges.
- Debt Reduction & Liquidity: Progress in reducing total debt below \$35 billion for the first time since 2015 is constructive for the balance sheet and credit outlook.
- Loyalty Program Growth: Strong engagement and credit card partnerships could drive higher-margin ancillary revenue long-term.
- Shareholder Equity Deficit: Continued negative equity position warrants monitoring, especially in a rising rate environment or if operating losses persist.
- Guidance Risks: Investors should be aware that guidance excludes unknown special items, and actual results could diverge due to market, regulatory, or operational disruptions.
Conclusion
American Airlines delivered a strong rebound in revenue and operational performance in Q1 2026, with historical highs in several key metrics. Management remains focused on premium services, loyalty, and network expansion, but faces significant headwinds from fuel costs and industry competition. The flat full-year profit outlook and ongoing risks could limit immediate share price upside, but successful execution of strategic initiatives and further cost containment would be positive catalysts.
Disclaimer: This article is for informational purposes only and does not constitute investment advice. Investors should review American Airlines Group Inc.’s official filings and consult with their financial advisors before making investment decisions. Forward-looking statements are subject to risks and uncertainties that could cause actual results to differ materially.