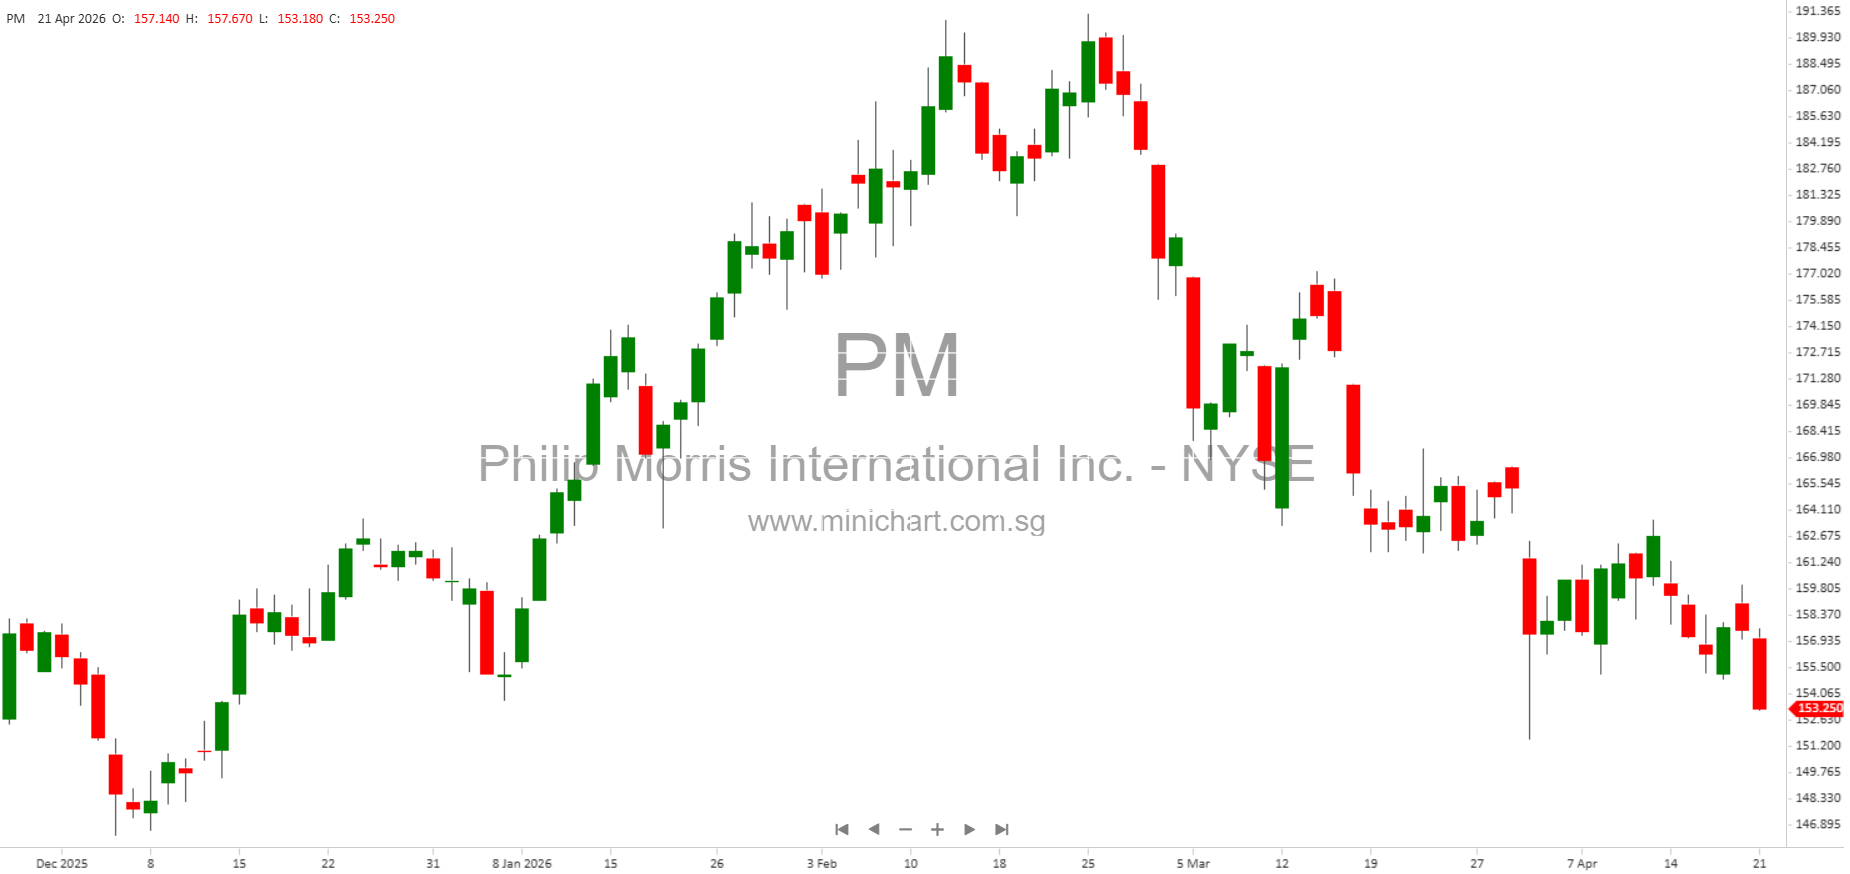
Philip Morris International Reports Strong Q1 2026 Results: Smoke-Free Business Drives Growth
Key Highlights from Q1 2026 Report
- Net revenues: Increased by 9.1% (2.7% organically) to \$10.1 billion.
- Adjusted Diluted EPS: Grew 16.0% to \$1.96; up 5.3% excluding currency.
- Reported Diluted EPS: Declined by 9.3% to \$1.56, attributed to a non-cash fair value adjustment related to minority shareholding in India.
- Smoke-Free Business: Now represents 43% of total net revenues, up 1.3 percentage points, with products available in 108 markets.
- Gross profit: Increased by 10.1% (3.8% organically), with margin expansion driven by pricing, operating leverage, and smoke-free product mix benefits.
Smoke-Free Segment Performance
- International Smoke-Free Segment: Net revenues up 24.7% (15.8% organically), driven by 11.9% volume growth and 28.6% gross profit growth (19.4% organically).
- IQOS Growth: IQOS surpassed Marlboro as the #1 brand in markets where present, gaining 1.7pp to reach 10.9% share of combined cigarette and HTU industry volumes.
- HTU IMS in Japan: IQOS holds close to 70% of the heat-not-burn category; HTU category reached approx. 53% of total nicotine national offtake. IQOS HTU adjusted IMS share of total nicotine increased by 2.7pp to a record 34.9%.
- Europe: IQOS HTU adjusted IMS grew by 5.4%, market share up 1.1pp to 6.6%. Growth led by strong performance in Italy, Greece, Germany, Spain, and Serbia.
- Other Markets: Adjusted IMS grew 19.4% outside Europe and Japan; IQOS national offtake share in Taiwan reached almost 6% in March.
- Oral SFP: ZYN now available in 58 markets, but total oral SFP shipment volume decreased 5.1% due to snus declines in Nordics. ZYN offtake share growing outside Nordics, including Pakistan, Poland, and UK.
- E-vapor SFP: VEEV shipments exceeded one billion units for the first time; VEEV now shares #1 closed pod position in Europe.
Combustibles and U.S. Segment Overview
- International Combustibles: Volumes declined by 5.1% after previous exceptional growth. Net revenues grew by 6.8% (1.0% organically), supported by strong pricing (+8.5%). Marlboro gained share to 10.7%.
- U.S. Segment: ZYN offtake volumes grew 10% per Nielsen, but shipment volumes declined 23.5% due to inventory normalization and uneven competitive landscape. Smoke-free shipment volumes fell 21.2%; net revenues and profits also declined.
- Regulatory Development: PMI preparing to launch ZYN ULTRA, pending FDA review.
Detailed Financial Results
| Segment | Net Revenues (\$bn) | Gross Profit (\$bn) | Operating Income (\$bn) | Reported vs Q1 2025 | Organic vs Q1 2025 |
|---|---|---|---|---|---|
| PMI International Smoke-Free | \$3.8 | \$2.7 | N/A | +24.7% | +15.8% |
| International Combustibles | \$5.7 | \$3.8 | N/A | +6.8% | +1.0% |
| U.S. | \$0.6 | \$0.4 | \$0.1 | -30.8% | -31.6% |
| Total PMI | \$10.1 | \$6.9 | \$3.9 | +9.1% | +2.7% |
EPS and Full-Year Guidance
- Reported Diluted EPS for Q1 2026: \$1.56 (down from \$1.72 in Q1 2025).
- Adjusted Diluted EPS: \$1.96 (up from \$1.69 in Q1 2025).
- Full-Year 2026 Forecast:
- Reported Diluted EPS: \$7.56–\$7.71
- Adjusted Diluted EPS: \$8.36–\$8.51 (up 10.9%–12.9%)
- Adjusted Diluted EPS, excluding currency: \$8.11–\$8.26 (up 7.5%–9.5%)
- Guidance Assumptions:
- Estimated industry volume decline of ~2% for cigarettes and HTUs (excluding China & U.S.)
- Stable PMI total cigarette and SFP shipment volume, high-single digit SFP shipment growth, ~3% cigarette decline
- Organic net revenue growth of 5%–7%
- Organic operating income growth of 7%–9%
- Operating cash flow around \$13.5 billion
- Capex of \$1.4–\$1.6 billion, mainly for smoke-free business
- Target net debt to adjusted EBITDA ratio close to 2.0x by end of 2026
- No share repurchases planned
- Q2 adjusted diluted EPS forecast: \$2.05–\$2.07
- Notable adjustments: Restructuring charges, impairment of wellness business-related equity investment, litigation charges, tax impacts, and loss on expected sale of consumer accessories.
Important Shareholder Considerations
- Smoke-Free Transition: PMI’s smoke-free business now accounts for 43% of net revenues, with continued investment and expansion. This is a strategic shift that could significantly impact future earnings and valuation.
- IQOS Leadership: IQOS surpassing Marlboro in key markets is a major milestone, positioning PMI as the global leader in heat-not-burn products with a 77% volume share in the category.
- Regulatory Risks: The report highlights ongoing risks from regulatory and marketing restrictions, excise tax increases, litigation, and geopolitical instability (notably Russia-Ukraine and Middle East conflicts).
- U.S. Market Dynamics: Short-term headwinds from ZYN shipment declines due to inventory normalization and regulatory uncertainties, but long-term growth investments continue.
- Middle East Conflict: Cited as having a small impact in Q1, PMI has factored in higher input costs for full-year guidance but does not expect a prolonged impact.
- Currency Risks: Currency movements have favorable impacts on adjusted EPS; investors should note future volatility risk.
- No Share Repurchases: PMI has not planned any share repurchases for 2026, which could affect capital allocation perceptions.
Strategic Outlook
PMI has invested over \$16 billion since 2008 in developing and commercializing smoke-free products, with a goal of ending cigarette sales. The company is expanding into wellness areas and continues to build its science-based portfolio and regulatory approvals (notably FDA approvals for IQOS and ZYN).
Risks and Forward-Looking Statements
Investors should be aware of numerous risks outlined by PMI, including regulatory, competitive, litigation, geopolitical, supply chain, and currency risks. PMI’s future profitability and share value may be affected by its ability to grow smoke-free products, manage regulatory changes, and execute on strategic goals.
Disclaimer: This article is for informational purposes only and does not constitute investment advice. All forward-looking statements are subject to risks and uncertainties, as outlined by PMI and in their public filings. Investors should review the company’s official documents and consult their financial advisors before making any investment decisions.