Boston Scientific Reports Strong Q1 2026 Earnings: Key Insights for Investors
Summary of Results
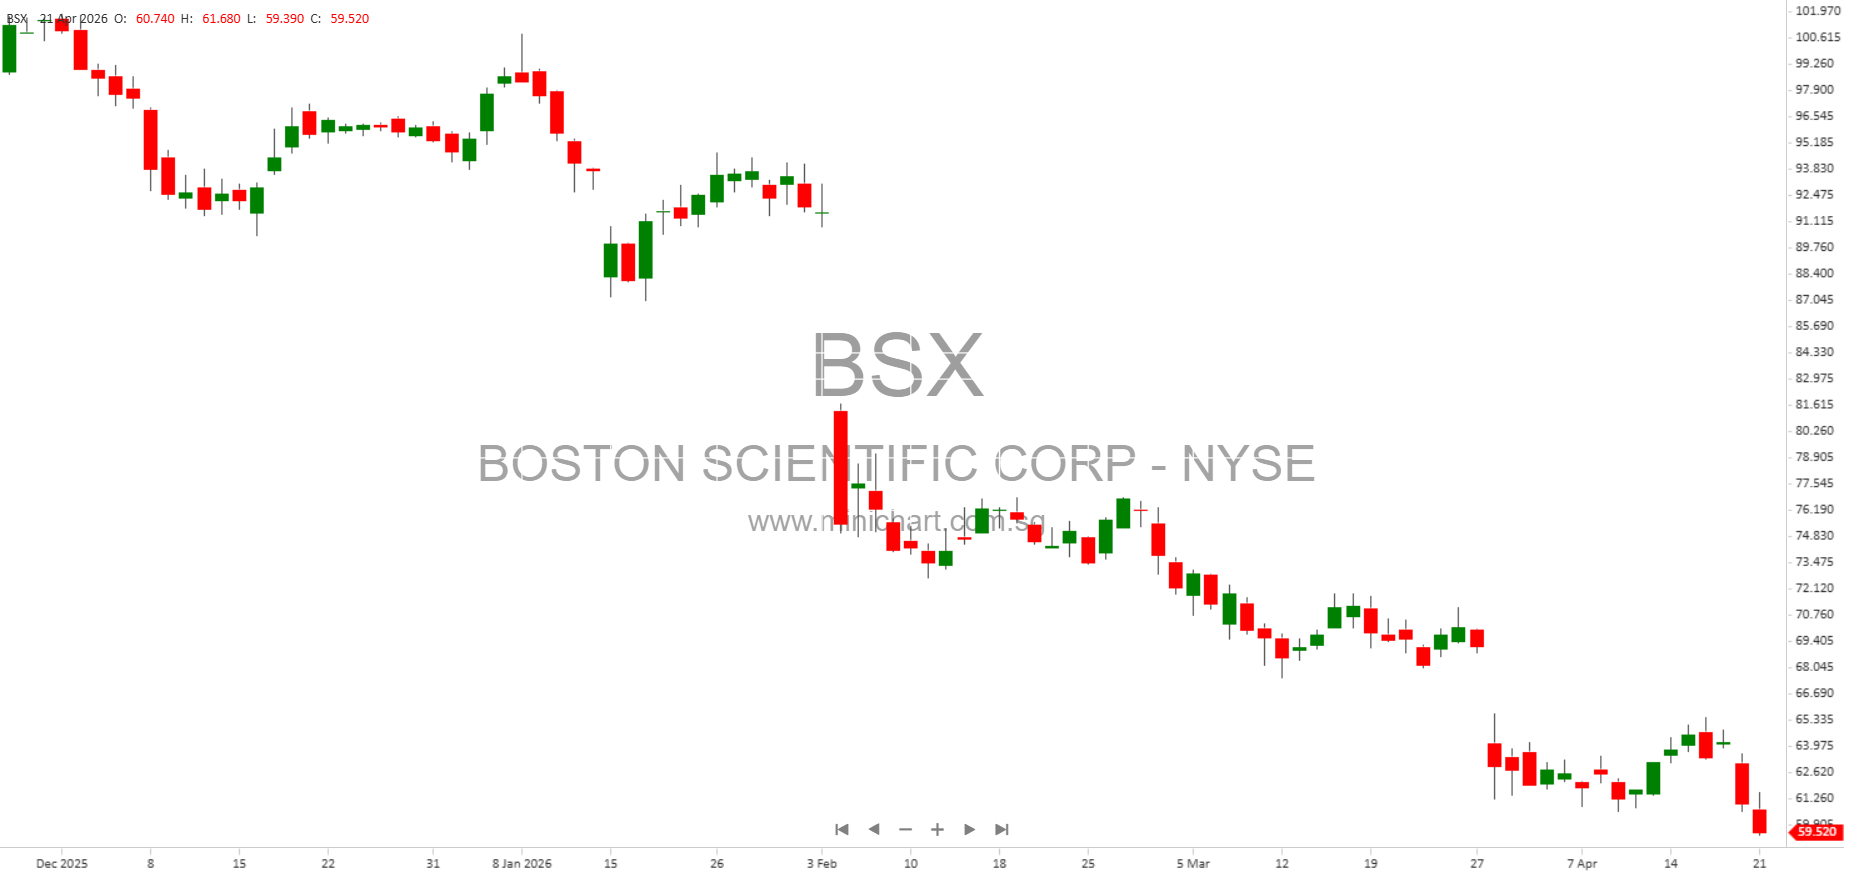
Boston Scientific Corporation (NYSE: BSX) has released its financial results for the first quarter ended March 31, 2026. The company delivered a solid performance, reporting net sales of \$5.203 billion, reflecting robust growth in its core businesses. The press release, issued April 22, 2026, provides several details that investors and shareholders should carefully consider.
Key Financial Highlights
- Net Sales: \$5.203 billion for Q1 2026.
- Net Income Attributable to Boston Scientific Common Stockholders: \$1.341 billion for Q1 2026, a significant increase compared to \$672 million in Q1 2025.
-
Basic and Diluted EPS:
- Basic: \$0.90 (Q1 2026) vs. \$0.46 (Q1 2025)
- Diluted: \$0.90 (Q1 2026) vs. \$0.45 (Q1 2025)
- Adjusted EPS (Non-GAAP): \$0.75 for Q1 2026, up from \$0.62 in Q1 2025.
- Gross Profit: \$3.614 billion (Q1 2026) vs. \$3.210 billion (Q1 2025)
- Operating Expenses: \$2.275 billion (Q1 2026) vs. \$2.088 billion (Q1 2025)
- Net Income Margin: Improved significantly year-over-year.
- Weighted-average Shares Outstanding: Basic: 1,484.9 million; Diluted: 1,491 million
Growth Metrics
- Reported Net Sales Growth: 5.5% for Q1 2026.
- Operational Net Sales Growth (Ex-FX): 7.5%.
- Organic Net Sales Growth (Ex-FX and Acquisitions/Divestitures): 8.5%.
Note: Operational and organic net sales growth exclude foreign currency fluctuations and, for organic growth, also certain acquisitions/divestitures without a full period of comparable results.
Segment and Operational Performance
- Selling, General & Administrative Expenses: \$1.781 billion (Q1 2026) vs. \$1.597 billion (Q1 2025)
- Research & Development Expenses: \$921 million (Q1 2026) vs. \$841 million (Q1 2025)
- Other Income (Expense): \$151 million (Q1 2026) vs. \$(34) million (Q1 2025) – indicates a positive swing in other income, likely from investments or non-core activities.
Key Price-Sensitive Details for Shareholders
- Significant Year-over-Year Growth in Net Income and EPS: The doubling of net income and EPS compared to the prior year is a strong positive signal and could be price sensitive.
- Strong Operational and Organic Growth: The operational (7.5%) and organic (8.5%) growth rates, which strip out foreign exchange and acquisition/divestiture impacts, highlight robust underlying demand and successful execution.
- Margin Expansion: The improved net income margin and gross profit suggest the company is scaling efficiently and controlling costs.
- Guidance: The company provided Q2 and full-year 2026 guidance, with reconciliations for non-GAAP measures, which will be of particular interest to analysts and investors evaluating future performance.
Important Notes on Non-GAAP Measures
Boston Scientific emphasizes the use of non-GAAP financial measures such as adjusted net income, adjusted EPS, operational and organic net sales growth rates. These measures exclude:
– Amortization expenses
– Goodwill and intangible asset impairments
– Acquisition/divestiture related charges
– Investment portfolio losses/gains and impairments
– Restructuring charges
– Litigation costs
– EU MDR implementation costs
– Debt extinguishment net charges
– Deferred tax and discrete tax items
These adjustments are intended to provide investors with greater transparency and insight into the company’s operating performance.
Forward-Looking Statements
The release contains forward-looking statements regarding expected net sales, revenue growth rates, adjusted EPS for Q2 and FY 2026, acquisitions, clinical trials, and future business strategies. Management cautions that actual results may differ due to risks including economic conditions, procedural volumes, integration of acquisitions, litigation, and execution of cost-saving and growth initiatives. Investors are advised not to place undue reliance on these statements.
Conference Call and Additional Information
Boston Scientific management hosted a conference call with analysts on April 22, 2026, at 8:00 a.m. ET. The webcast is available for one year at investors.bostonscientific.com. More details are available in the company’s Form 8-K and press release.
For further questions, investors may contact Boston Scientific’s Investor Relations and Media Relations teams directly.
Conclusion
The Q1 2026 results from Boston Scientific demonstrate significant growth in both top and bottom lines, with strong operational and organic sales momentum. The company’s profitability has improved, and its guidance for the year provides a positive outlook. These results, especially the outsized growth in net income and EPS, are likely to be seen as price sensitive and could influence the company’s share price.
Disclaimer: This article is for informational purposes only and does not constitute investment advice. Investors should read the full filings and consult their financial advisors before making investment decisions. Forward-looking statements are subject to risks and uncertainties, and actual results may differ materially.