OFG Bancorp Reports Robust Q1 2026 Results – Key Metrics, Financials, and Shareholder Implications
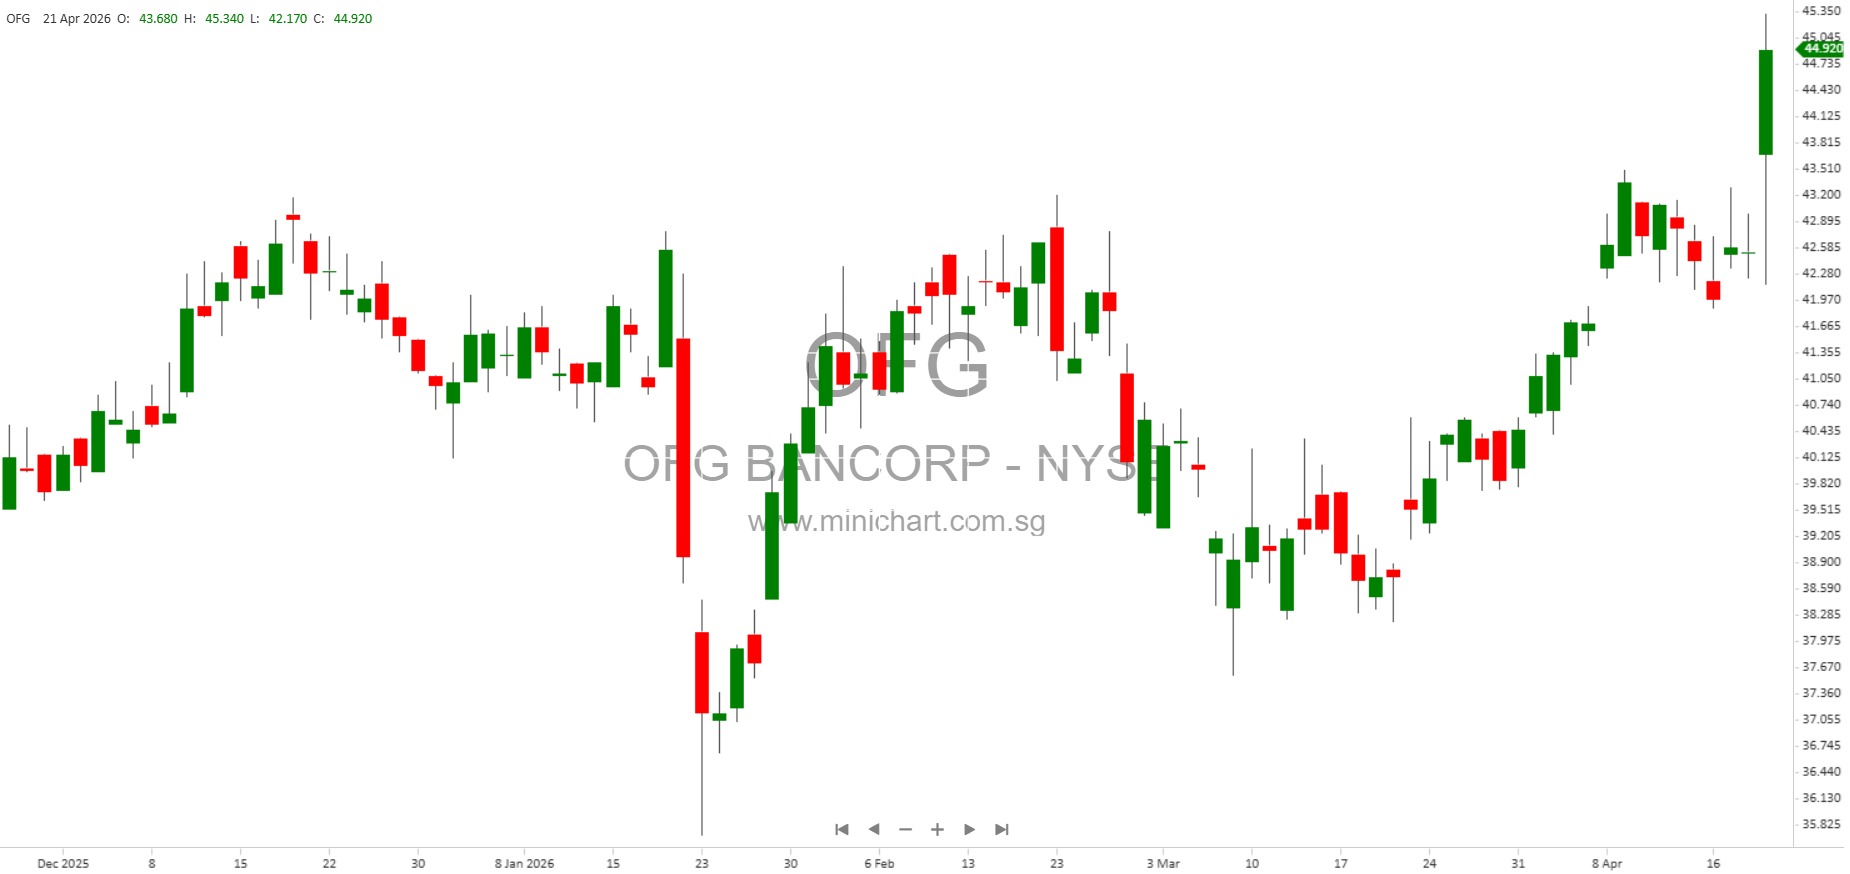
San Juan, PR – April 21, 2026: OFG Bancorp (NYSE: OFG) released its financial results for the first quarter ended March 31, 2026. The company delivered strong performance across several critical metrics, signaling ongoing stability and strategic progress. Below is a detailed breakdown of the report, with key highlights and aspects relevant to current and prospective shareholders.
Key Financial Highlights
- Net Interest Income: \$154.7 million in Q1 2026, up from \$151.9 million in Q4 2025 and \$149.1 million in Q1 2025, showing steady growth in the bank’s core lending and investment activities.
- Total Interest Income: \$194.1 million, a slight decrease from \$197.2 million in the previous quarter, but up from \$189.2 million a year ago. The decrease quarter-over-quarter was attributed to lower average balances of cash and investment securities at lower rates, partially offset by higher average loan balances at higher rates. Notably, this quarter included a \$3.3 million contribution from a paid-in-full PCD loan.
- Net Interest Margin (NIM): 5.36%, a robust figure indicating strong profitability from lending activities.
- Non-Interest Income (Core): \$31.99 million, demonstrating the bank’s diversified revenue streams outside traditional lending.
- Return on Average Assets (ROAA): 1.78%, indicating efficient asset utilization.
- Return on Average Tangible Common Stockholders’ Equity (ROTCE): 16.43%, reflecting attractive returns for common shareholders.
- Efficiency Ratio: 50.97%, showcasing effective cost management.
- Net Income Available to Common Stockholders: \$53.94 million, compared to \$55.89 million in Q4 2025 and \$51.84 million in Q1 2025.
- Basic Earnings Per Share: \$1.15 per share, up from \$1.01 in Q4 2025 and \$1.01 in Q1 2025.
- Diluted Earnings Per Share: \$1.15 per share, compared to \$1.00 in Q4 2025 and \$1.00 in Q1 2025.
- Cash Dividends per Common Share: \$0.30 (unchanged from prior quarters).
- Book Value Per Common Share: \$29.83 (up from \$28.83 in Q4 2025).
- Tangible Book Value Per Share: \$27.67 (up from \$26.66 in Q4 2025).
Balance Sheet and Capital Strength
- Total Assets: Average assets of \$7.96 billion, up from \$7.78 billion in Q4 2025.
- Stockholders’ Equity: \$1.41 billion, up from \$1.39 billion in Q4 2025.
- Common Equity Tier 1 (CET1) Capital Ratio: 13.75%, a slight decrease from 13.97% in Q4 2025, but still well above regulatory minimums and indicative of a strong capital position.
- Tangible Common Equity Ratio: 10.66%, up from 10.47% in Q4 2025.
- Leverage Ratio: 10.88%.
- Allowance for Credit Losses: \$181.2 million, covering 2.48% of loans held for investment, reflecting continued prudent risk management.
Other Financial and Strategic Items
- Non-Interest Expense: Well managed, supporting the strong efficiency ratio.
- Cash Position: Notably, cash declined by \$403.8 million from Q4 2025, largely due to a significant government deposit transfer to wealth management.
- Investments: Investment securities available-for-sale stood at \$2.46 billion, with held-to-maturity investments at \$264.6 million.
- Wealth Management Revenues: \$8.91 million, stable versus prior quarters.
- M ortgage Banking Activities: \$6.13 million in revenue, up from \$4.78 million in Q4 2025.
Operational and Shareholder Considerations
- Conference Call & Investor Resources: OFG held an investor call to discuss results and outlook. Full financial tables and presentations are available on the company’s investor relations website.
- Non-GAAP Metrics: The company continues to publish reconciliations of GAAP and non-GAAP measures, enhancing transparency for investors.
- Forward-Looking Statements: Management reminded investors of potential risks including general economic conditions, interest rate fluctuations, cybersecurity, natural disasters, and competitive pressures.
Price-Sensitive Items and Shareholder Implications
- Solid Capital & Profitability: The strong CET1, tangible equity ratios, and robust earnings per share growth are positive indicators for continued dividend stability and potential future capital return to shareholders.
- Stable and Growing Book Value: Sustained growth in both book value and tangible book value per share supports shareholder equity growth and may positively affect share valuation.
- Consistent Dividend: The maintained cash dividend of \$0.30 per share, alongside rising earnings, reflects confidence in ongoing profitability and prudent capital management.
- Interest Margin & Efficiency: The industry-leading NIM and sub-51% efficiency ratio underline strong core banking performance, which could invite positive market sentiment and price movement.
- Liquidity Management: The significant decrease in cash, driven by a large government deposit transfer to wealth management, is notable. While not negative, investors should monitor the impact of such deposit flows on future liquidity and interest income volatility.
- Provisioning & Asset Quality: The high allowance for credit losses relative to loans signals prudent risk management but may warrant monitoring if credit trends worsen.
Conclusion
OFG Bancorp has reported a strong first quarter for 2026, with positive trends in net interest income, earnings, capital strength, and shareholder value metrics. The bank’s core profitability, capital ratios, and cost controls remain robust. The continued payment of stable dividends and growth in book value per share are likely to be viewed favorably by the market. Investors should, however, be aware of liquidity movements and ongoing provisioning levels, though current figures suggest a well-managed institution with solid prospects.
Disclaimer: This article is for informational purposes only and does not constitute investment advice or a recommendation to buy or sell any securities. Investors should review the company’s official filings and consult with financial advisors before making any investment decisions. Forward-looking statements are subject to risks and uncertainties that may cause actual results to differ materially from those discussed herein.